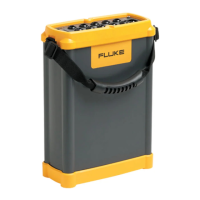
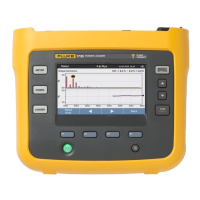
Power Recorder
Recorded Data Screen Overview
29
starting a recording session. You can also create a password in this
mode.
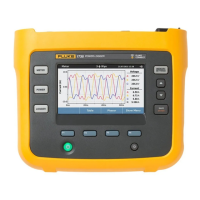
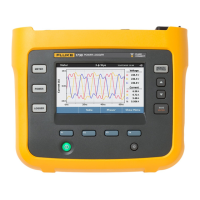
• 1750 Live lets you monitor data directly, when you are connected to a
Recorder.
• 1750 Download lets you retrieve data from the Recorder and save it
on your computer.
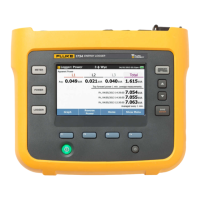
Recorded Data Screen Overview
Recorded data views are the primary screens you work with when analyzing
power quality data. Five different views of recorded data are available:
Summary, Volts/Amp/Hz, Events, Harmonics, THD, Flicker, and
Power/Energy. Figure 4 shows a sample Recorded Data Screen and Table 5
describes the contents of the screen.
In many of the recorded data views you see both a Reference graph and a
Detail graph. The reference graph shows the full range of available data. The
detail graph shows a subset of that data. For more information about the screen
menu and buttons, refer to the section “Overview of the Power Analyze
Screen” earlier in this manual.
When you work with recorded data, many of the elements on the screen are the
same regardless of which view is displayed.
Note
Check the Fluke website (www.fluke.com
) for updates.
 Loading...