Power Recorder
Snapshot Screen Overview
33
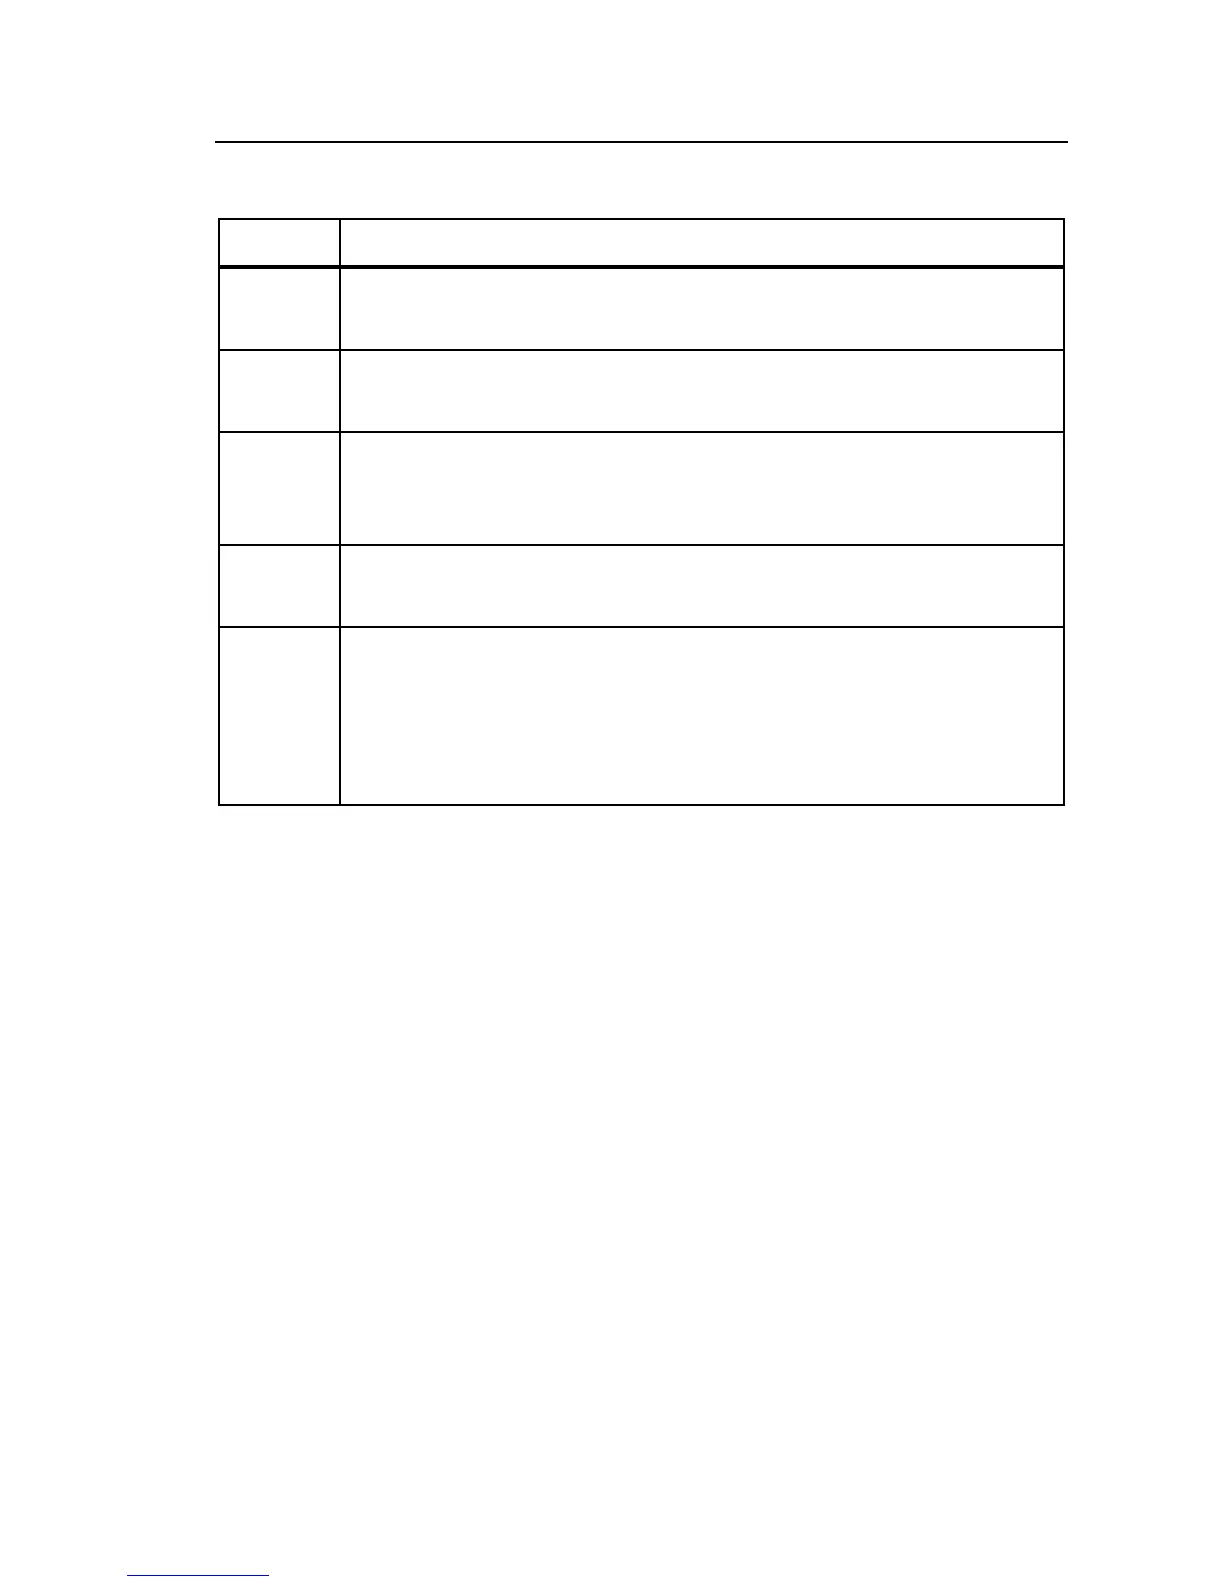
Table 6. Live View Screen Contents
Number Description
Connected recorder. Shows the name of the Recorder to which
you are connected.
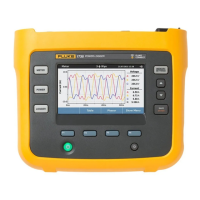
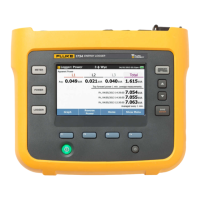
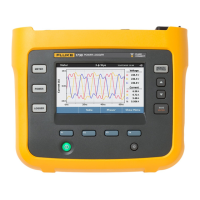
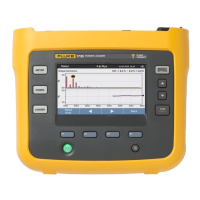
Main data area. Displays the power quality parameters you are
viewing: Scope, PHASOR diagram, meter, harmonics, or power.
View toolbar. Lets you change between live views. The active
button indicates the view you see now. In the screenshot above,
Scope is active.
View controls. Specify what data to display in the view, and how
it should appear.
Status bar. Shows the 1750 setup, including Recorder name, IP
address, power configuration, nominal voltage, and frequency.
You can set this information using the 1750 Setup mode, or using
Power View on the PDA. For more information setting up a
Recorder through Power Analyze, see the Online Help.
Snapshot Screen Overview
Snapshots are screen captures at a single point in time of the measurements
made by the Recorder as displayed in 1750 Live mode. When you download
data, you download snapshots (taken manually and at regular intervals), along
with the long-term summary data and events. All five views that are available
for live power are also available in the snapshot views, giving you a detailed
view of conditions at specific intervals.
When you first display the Snapshot views, you see the first snapshot taken in
the downloaded data. You can use the Slider Bar or the Next/Previous buttons
to bring additional snapshots into view.
The interval at which snapshots are captured is specified when the Recorder is
set up. In addition, a snapshot can be taken manually using the PDA or using
the Take Snapshot button.
Figure 6 shows the main elements in snapshot views. More detail on specific
snapshot screen elements are described in Table 7.
 Loading...