1750
Getting Started Guide
40
Using the Manual Scale on the time axis allows you to enter either the
start and end date or the start date and a time span from a predefined list.
4. Click OK to apply the changes.
Screen View Tools
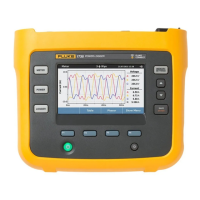
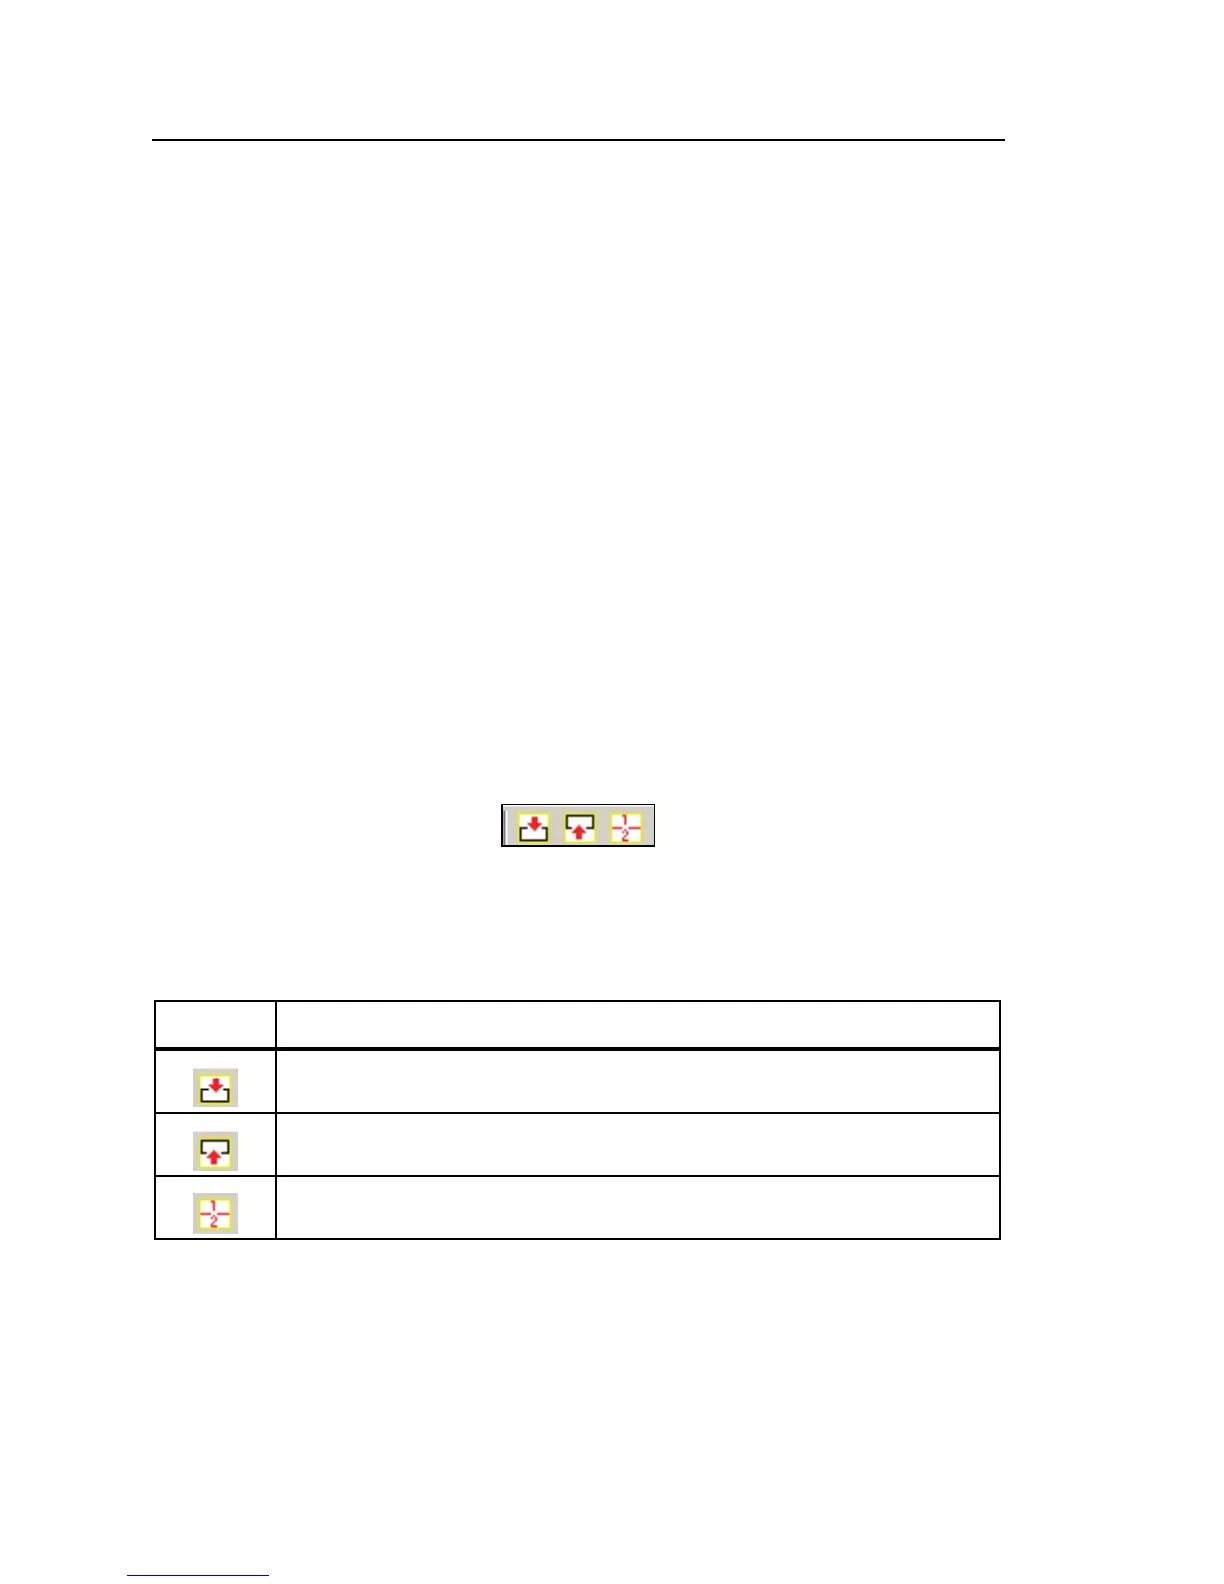
When you first view recorded data, the views show two types of data in a split
view format. Figure 9 shows a sample Screen View Tools and Table 10
describes the tools.
For most views, the data includes reference data, which gives a broad view of
the recorded data, and detail data in the display’s top half, which appears in the
bottom half of the display.
Options on the left toolbar let you expand either set of data to fill the window.
Note
This feature also works when you are displaying as a table either the
top or bottom set of data.
bae025s.bmp
Figure 9. Screen View Tools
Table 10. Screen View Tools
Button Description
Click to see the top full screen view.
Click to see the bottom full screen view.
Click to see both graphs again.
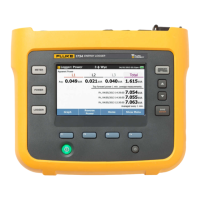
Viewing Data as a Table
In most recorded data views, you can view data in table format as well as in
graph format. This is useful for studying results in the form of digital readings,
or preparing tabular data for a report.
 Loading...