Power Recorder
Viewing Data as a Table
41
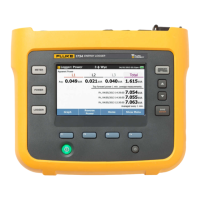
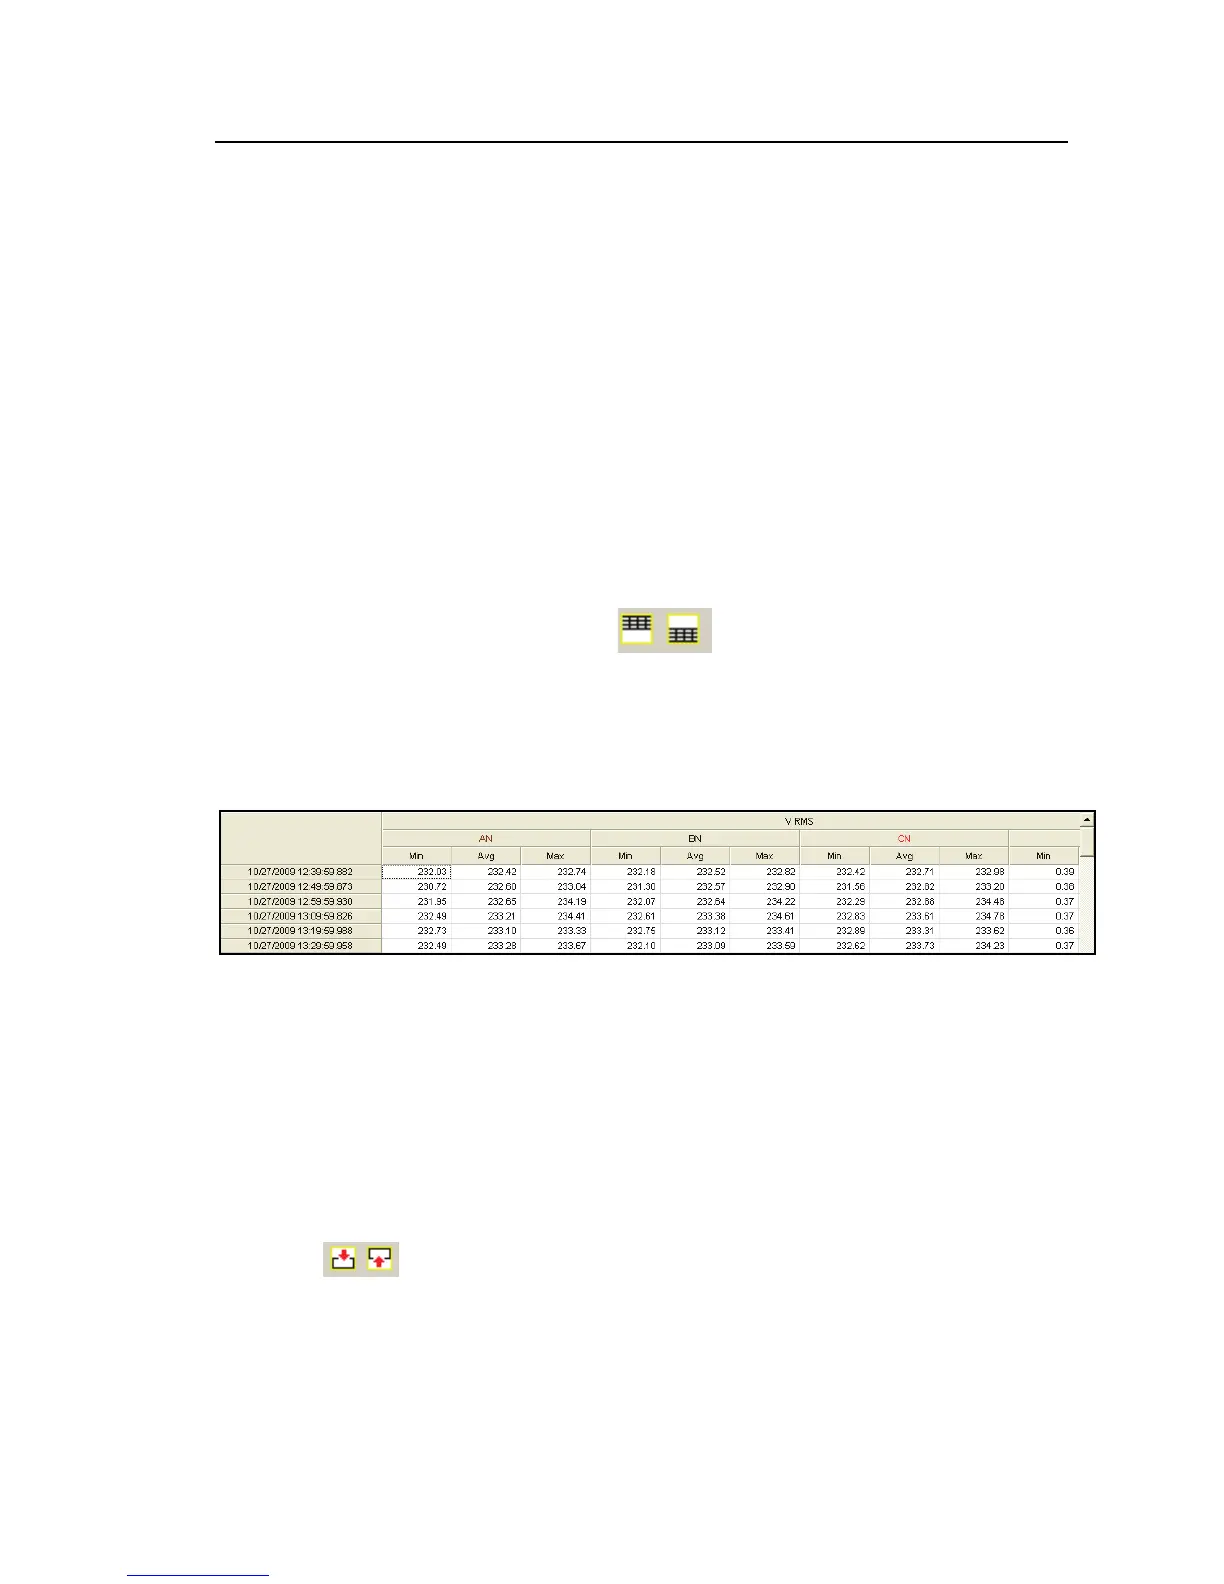
When you switch to the table display, the tables generated remain on the
screen even as you change recorded data views, until you turn off the table
display and switch back to graphs.
Note
If you click the Tag for Report button when a table is in view, the
portion of the table in view will be included in your next report. (For
more information, see “Building a Report” later in this manual.) To
print all of the data in the table, first export it to a spreadsheet.
To toggle between graph and table views:
You can toggle between graph and table views for the top graph, the bottom
graph, or both graphs.
• Click one of the Table tools
to display the upper or lower
graph as a table.
• Click the Table tool again to return to the graph display shown in
Figure 10.
azd214.png
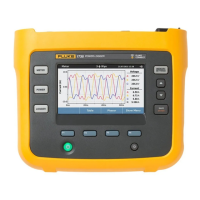
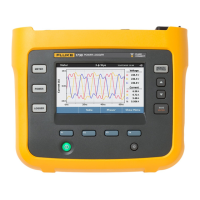
Figure 10. Graph Display
To sort the data in a table:
• When you view Events in a table, you can sort the tables by clicking
the header for the column you want to sort by.
To maximize a table to full size:
• Click the Top Full View button or the Bottom Full View button
(
), depending on which table you want to view full size.
 Loading...