8
GPSMAP
®
585 Plus
Adding the Depth Data Graph Page
Before you can customize the Depth Data Graph page, you must add it to the
home screen.
From the home screen, select Customize Home > Add > Sonar > Depth
Data Graph.
Adding the Temperature Data Graph Page
From the home screen, select Customize Home > Add > Temperature
Data Graph.
Data Fields
Data elds display multiple types of information in one area, such as depth,
heading, and bearing. Some data elds require you to be navigating or
require a connection to sensors to display data. For example, a temperature
sensor must be connected to the chartplotter to display the temperature data
eld.
The data elds on a page depend on the type of data associated with that
page. For example, a sonar page automatically displays sonar-related
information such as Depth.
You can congure the data elds that display on a page The different data will
depend on the different working mode. Select MENU > Overlay Numbers.
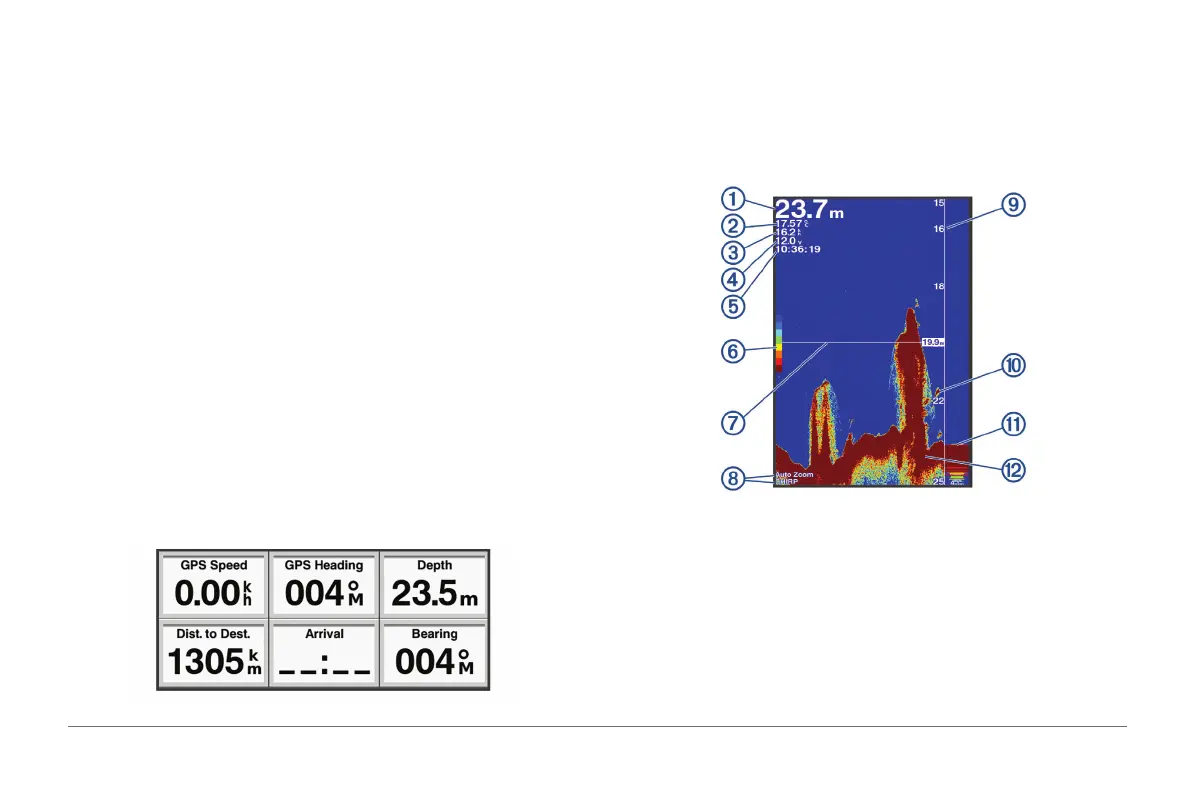
Sonar
Full Screen Sonar
You can see a full-view graph of sonar readings from a transducer on the full
screen.
Select Traditional.