Appendix 45
strides, and slightly higher vertical oscillation. Vertical ratio is your vertical oscillation divided by stride length. It is
not correlated with height.
Go to Garmin.com/runningdynamics for more information on running dynamics. For additional theories and
interpretations of running dynamics data, you can search reputable running publications and websites.
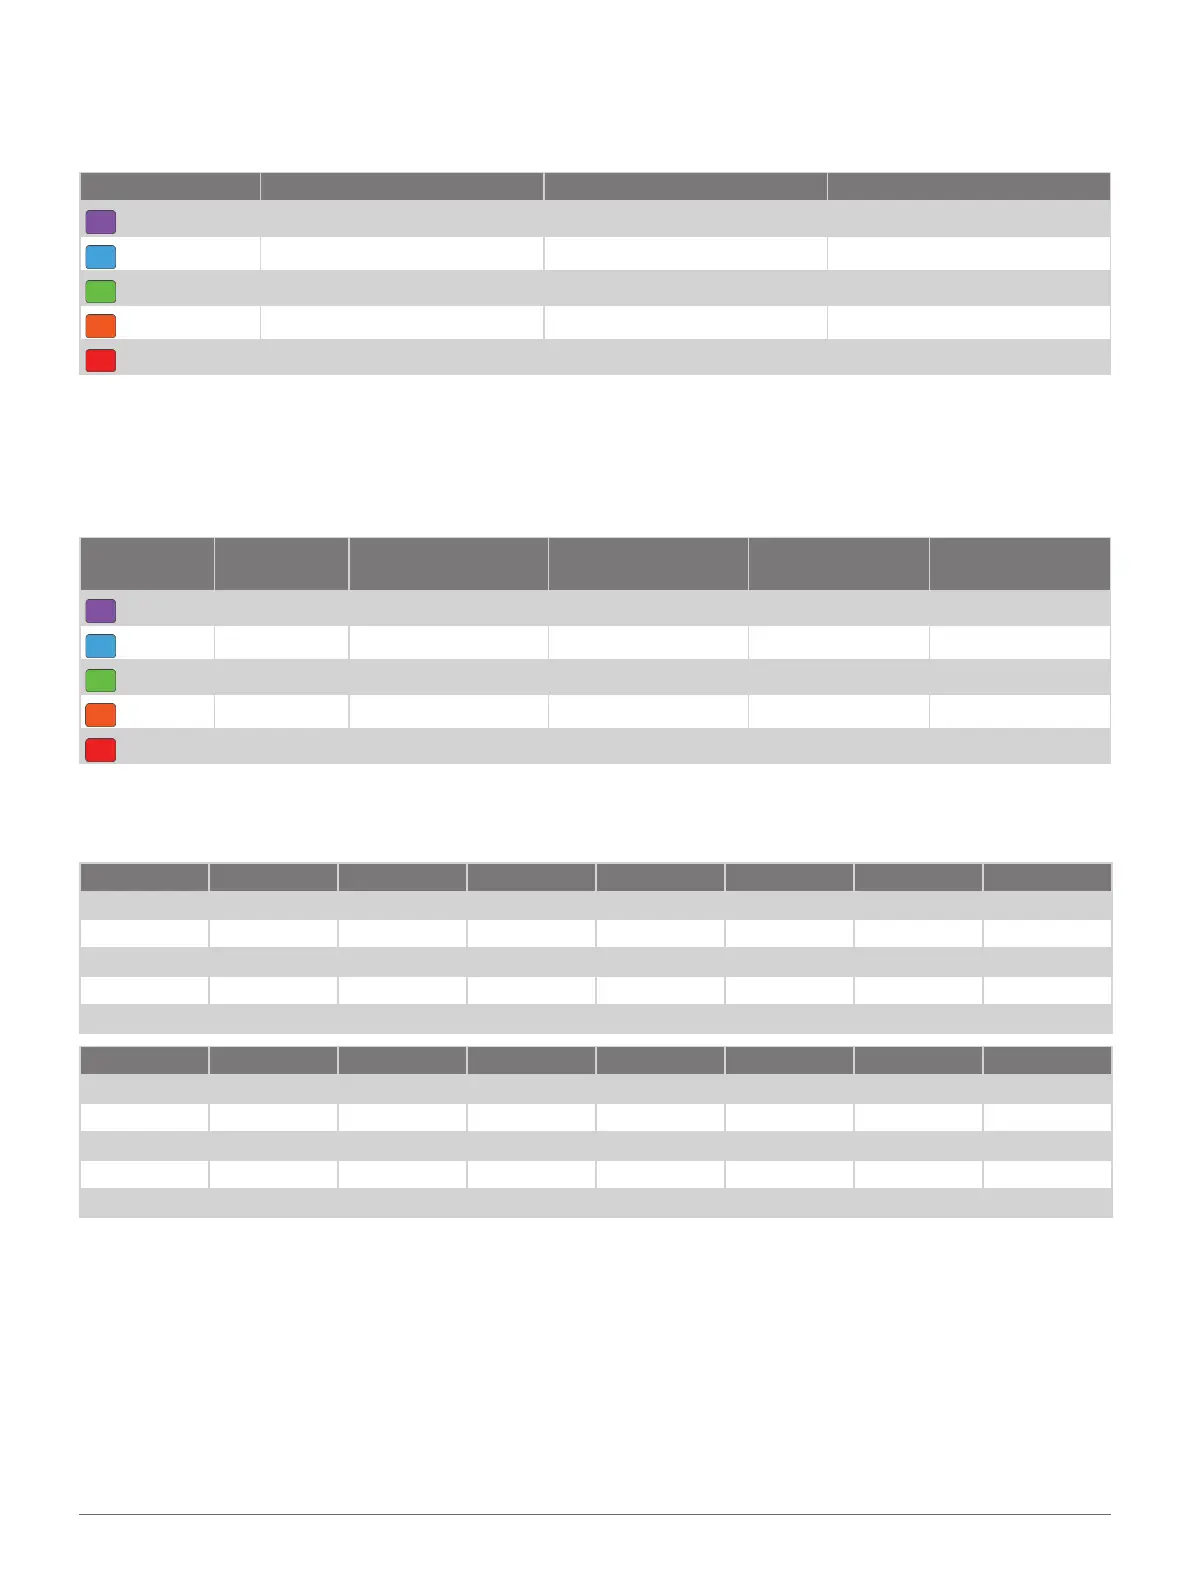
Color Zone Percentile in Zone Cadence Range Ground Contact Time Range
Purple
>95 >183 spm <218 ms
Blue
70–95 174–183 spm 218–248 ms
Green
30–69 164–173 spm 249-277 ms
Orange
5–29 153-163 spm 278-308 ms
Red
<5 <153 spm >308 ms
Vertical Oscillation and Vertical Ratio Data
NOTE: In the Garmin Connect activity, the running dynamics data displays as colored graphs.
The data ranges for vertical oscillation and vertical ratio are slightly different depending on the sensor and whether
it is positioned at the chest (HRM-Fit or HRM-Pro series accessories) or at the waist (Running Dynamics Pod
accessory).
Color Zone
Percentile in
Zone
Vertical Oscillation
Range at Chest
Vertical Oscillation
Range at Waist
Vertical Ratio at
Chest
Vertical Ratio at
Waist
Purple
>95 <6.4 cm <6.8cm <6.1% <6.5%
Blue
70–95 6.4–8.1 cm 6.8-8.9 cm 6.1-7.4% 6.5–8.3%
Green
30–69 8.2-9.7 cm 9.0-10.9 cm 7.5–8.6% 8.4–10.0%
Orange
5–29 9.8-11.5 cm 11.0-13.0 cm 8.7–10.1% 10.1–11.9%
Red
<5 >11.5 cm >13.0 cm >10.1% >11.9%
VO2 Max� Standard Ratings
These tables include standardized classifications for VO2 max. estimates by age and sex.
Males Percentile 20–29 30–39 40–49 50–59 60–69 70–79
Superior 95 55.4 54 52.5 48.9 45.7 42.1
Excellent 80 51.1 48.3 46.4 43.4 39.5 36.7
Good 60 45.4 44 42.4 39.2 35.5 32.3
Fair 40 41.7 40.5 38.5 35.6 32.2 29.4
Poor 0-40 <41.7 <40.5 <38.5 <35.6 <32.3 <29.4
Females Percentile 20–29 30–39 40–49 50–59 60–69 70–79
Superior 95 49.6 47.4 45.3 41.1 37.8 36.7
Excellent 80 43.9 42.4 39.7 36.7 33 30.9
Good 60 39.5 37.8 36.3 33 30 28.1
Fair 40 36.1 34.4 33 30.1 27.5 25.9
Poor 0-40 <36.1 <34.4 <33 <30.1 <27.5 <25.9
Data reprinted with permission from The Cooper Institute. For more information, go to www.CooperInstitute.org.
Wheel Size and Circumference
Your speed sensor automatically detects your wheel size. If necessary, you can manually enter your wheel
circumference in the speed sensor settings.
The tire size is marked on both sides of the tire. You can measure the circumference of your wheel or use one of the
calculators available on the internet.