Quantitative Analysis
382 Vivid S5/Vivid S6 User Manual
R2424458-100 Rev. 2
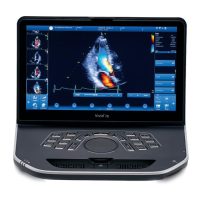
The analysis window
TVI:
Displays velocity trace
1. Y axis: velocity scale (cm/s)
2. X axis: Time (s)
3. ECG
4. Time at cursor position
5. Velocity at cursor position
6. Velocity at frame marker position
(color coded)
Tissue Tracking:
Displays tissue displacement trace
1. Y axis: displacement scale (mm)
2. X axis: time (s)
3. ECG with Tracking start and Tracking
end markers
4. Time at cursor position
5. Displacement at cursor position
6. Displacement at frame marker
position (color coded)
Strain rate:
Displays Strain rate trace (rate of deformation
(s
-1
))
1. Y axis: s
-1
2. X axis: time (s)
3. ECG
4. Time at cursor position
5. Strain rate at cursor position
6. Strain rate at frame marker position
1
2
3
45
-2.3
6
 Loading...