FHO5000
10
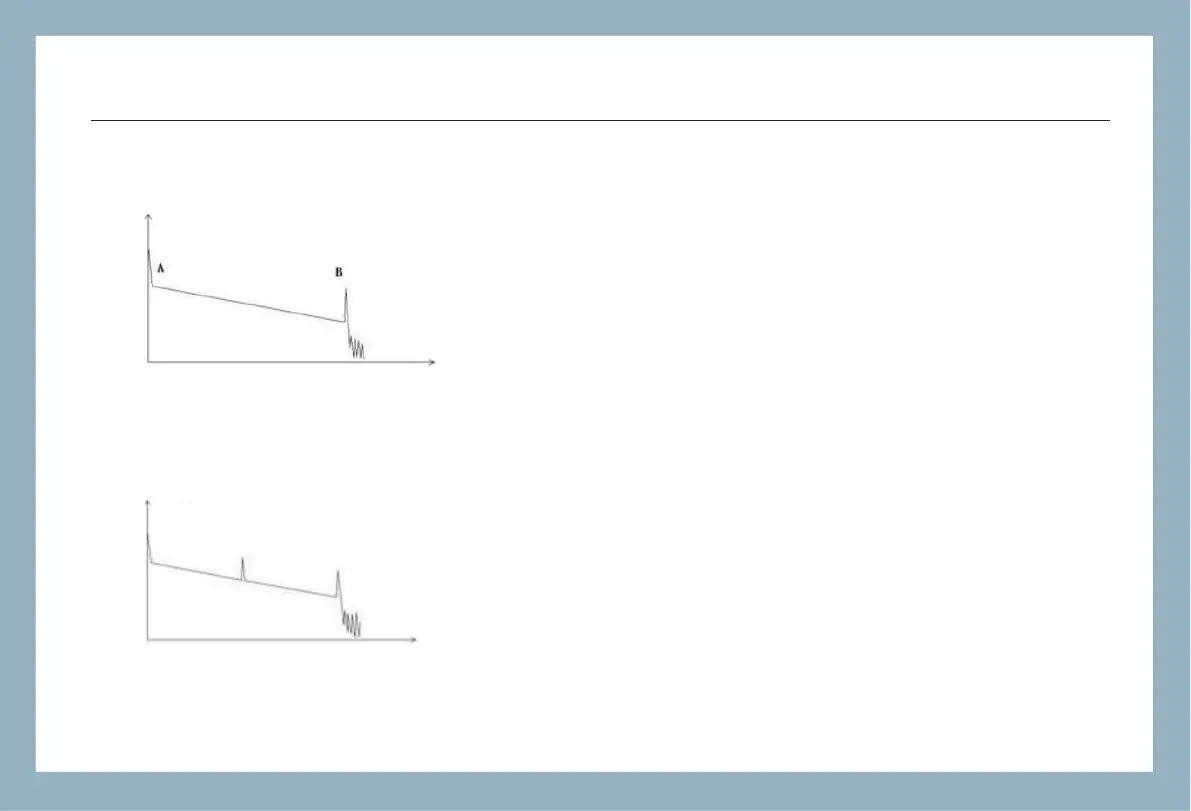
Normal Curve
A normal trace shows as above, the A mark is a start-peak and the B mark is a
end-reflection-peak. The tested trace is oblique, the total loss will become bigger
with the increasing of the fiber length. The total loss(dB) divides total length is the
average loss(dB/km) of a fiber.
If there is additional reflection peak in a tested trace, this may be caused by a
connection point or some other reasons. Anyway, appearance of the reflection
peak shows that the two connecting surfaces of the connection are smooth. The
smoother the connection surfaces are, the higher the reflection peak is.
For an instance, if a broken optical line is under test, the OTDR trace will show a
broken point. After a maintenance of this line, use the OTDR test it again, we may
see a reflection peak replacing the broken point on the OTDR trace, this shows the
maintenance is done.
Curve with Jumper Connected
 Loading...