FAXITRON PATH USER MANUAL | HOLOGIC | REVISION 024
ECTION
ISION
oftware
5
5-25
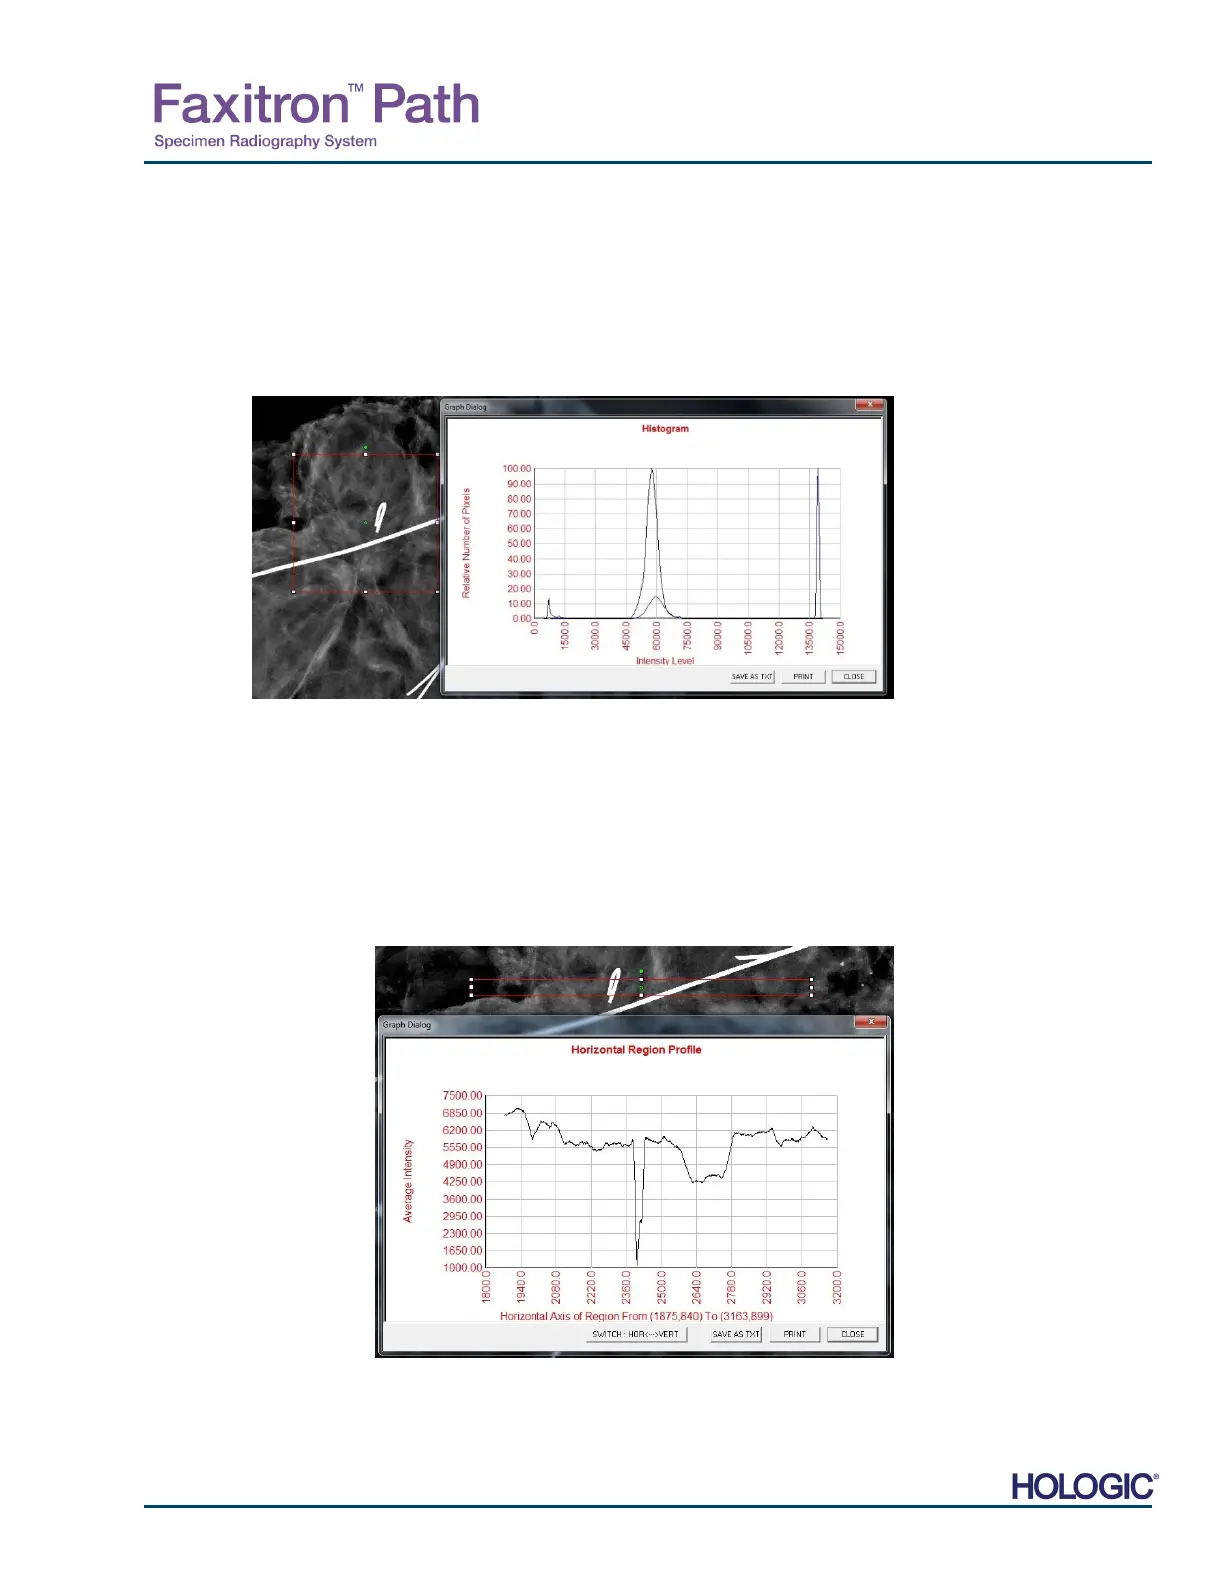
ROI Histogram
“ROI Histogram” will create a histogram for a user defined ROI. After selecting the menu item,
place the mouse cursor in the displayed image, press and hold down the left mouse button and
drag the cursor to make the desired ROI selection. Release the mouse button. Histograms fo
the selected ROI will be displayed. See Figure 5.4.6.
The Black curve is the Histogram of the selected region. The Blue curve is the Histogram of the
whole image. Both curves are normalized against the peak maximum pixel value of the selected
region of interest. Click “ROI Histogram” again to turn off the feature.
ROI Profile
“ROI Profile” will create a profile for a user defined ROI. After selecting the menu item place the
cursor in the displayed image. Hold down the left mouse button and the move cursor across the
image to draw a user-defined box around the desired ROI. Release the left mouse button and
a profile will be displayed showing the individual pixel value of the defined ROI. See Figure
5.4.27. By default, the averaging direction of the selected ROI is the short axis. The axis may
be toggled back and forth by selecting the SWITCH, HOR<->VERT button. Click “ROI Profile
again to turn off the feature.
5.4.5 Cont.
Figure 5.4.26
ROI Histogram
Figure 5.4.27
ROI Profile