➢ Nominal values of the module being tested under STC conditions as defined in the
internal DB (see § 6.3)
➢ Measurement results calculated under STC conditions as a function of irradiance
values measured by the connected SOLAR03 remote unit
➢ Indication of the value of the parameter p% in compliance with the control
conditions shown in § 6.4.4
➢ Icons , , , to indicate the result of the measurement (see § 6.4.4)
13. The following additional results can be viewed by scrolling left or right. Results under
OPC conditions: the following screen appears on the display:
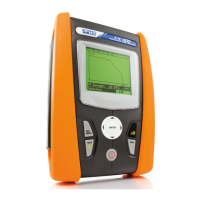
Fig. 38: Example of I-V curve measurement result - OPC values
14. The measurement result screen shows the following parameters:
➢ Values of the test parameters set in the main screen (number of modules, number
of strings in parallel, years of operation and annual performance percentage)
➢ Measurement results of electrical and environmental parameters (irradiance and
module temperature) under OPC conditions
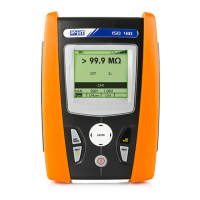
15. Graphs of I-V and power curves under OPC and STC conditions. Examples of
screens are shown in the following figures
Fig. 39: Example of I-V curve measurement result - STC curve