The StellarMate Plus Manual
310 / 341
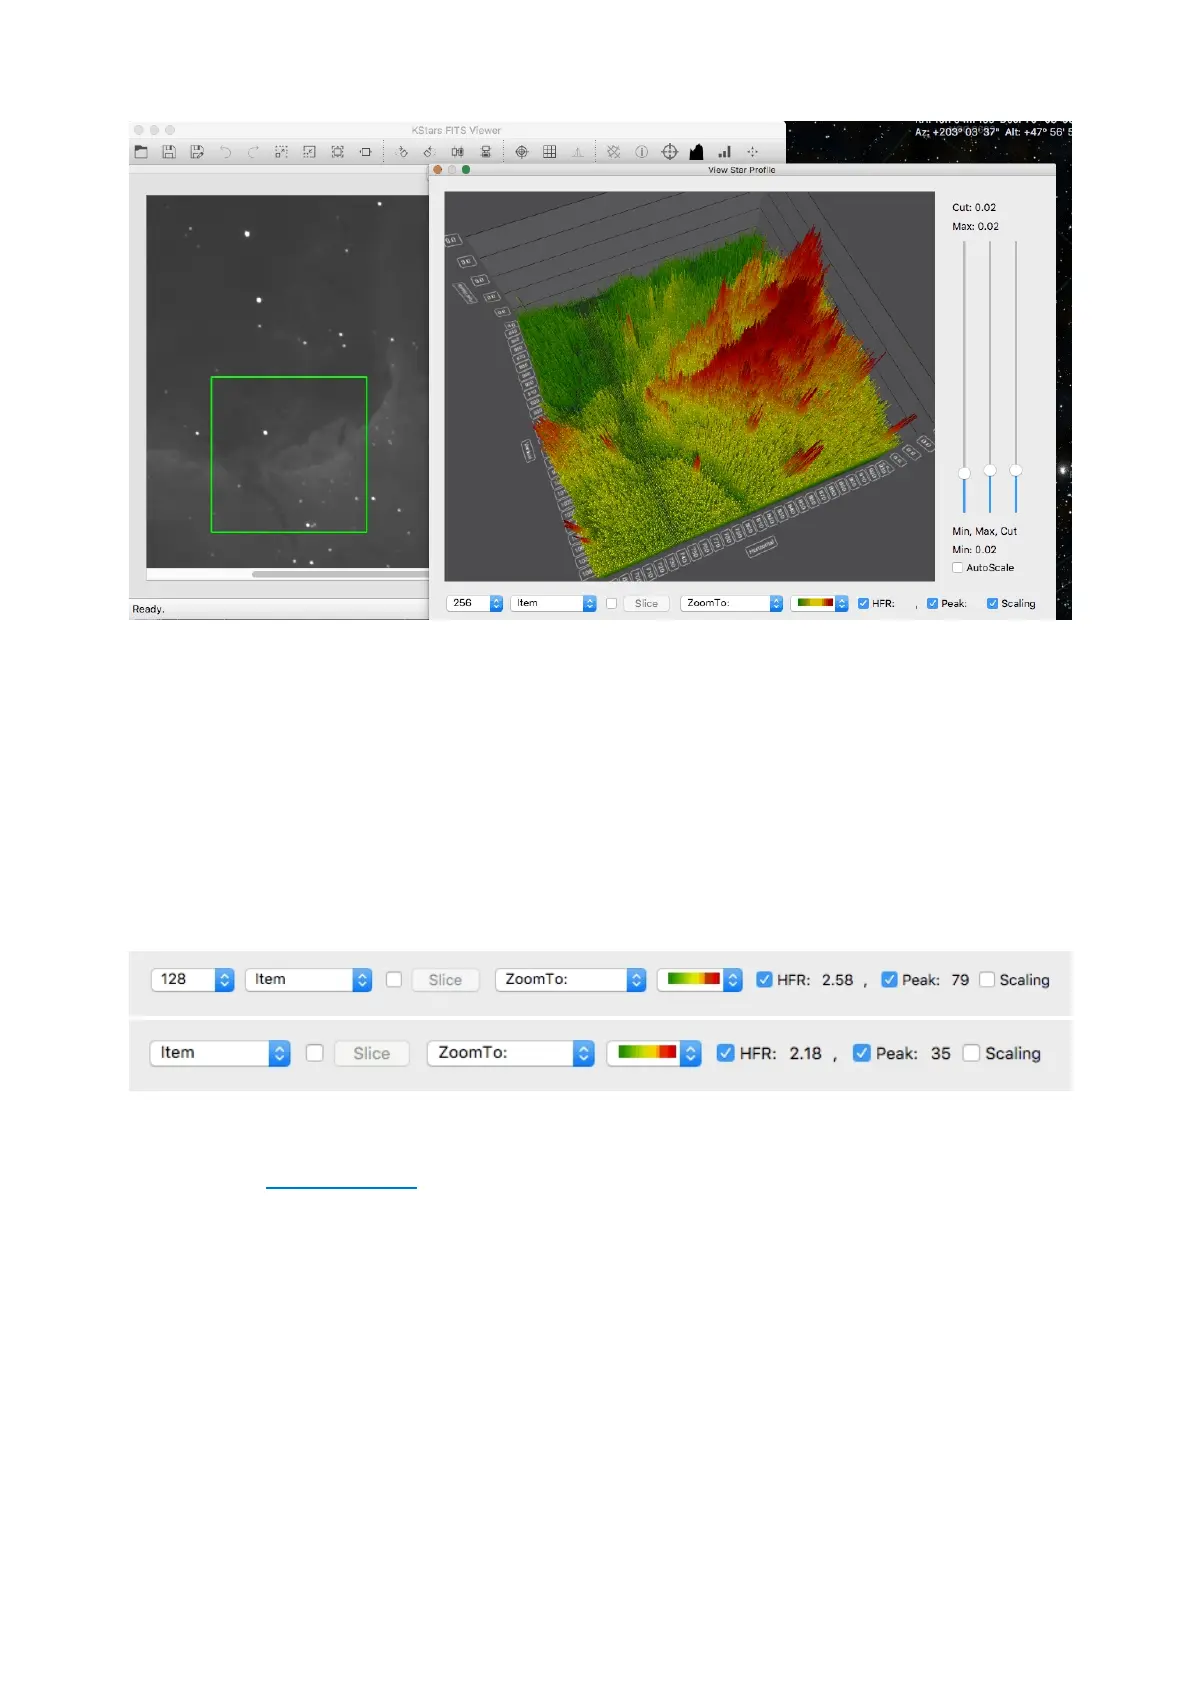
The 3D data visualization tool can plot 3D graphs of the selected region of the
image. This is particularly useful for astrophotographers who want to visualize
the profile of a star they are considering focusing or guiding on. For scientists, it
enables them to examine a cross-section of the data to understand the relative
brightness of different objects in the image. Additionally, it empowers imagers
who want to visually see what is going on in their data collection in a new way.
To use the new feature, the user needs to select the View Star Profile icon in one
of the Ekos Module Views, or in the FITS Viewer. Then, the region selected in the
green tracking box will show up in the 3D graph as shown above. The user will
then have one of the following toolbars at the bottom.
At the far left, the sample size combo box will let the user select the size of the
image crop shown in the graph. This option is only available in the Summary
Screen, the Align Module, and the FITS Viewer. The second combo box lets the
user control whether they are selecting an individual item, or a row, or a column
of pixels. The slice button will be enabled if the user selects Row or Column. It
will put the graph in slice mode so that the user can see a cross-section view of
the image. Third, is a checkbox that will open up two sliders that will let the user
drag the slider to change the selection. This is extremely useful in the slide mode
to change the selected point and to move the cross section around the graph. It
is also useful in the normal view when in Explore Mode so that the user can zoom
around the image examining the pixels.



 To Next Page