The StellarMate Plus Manual
311 / 341
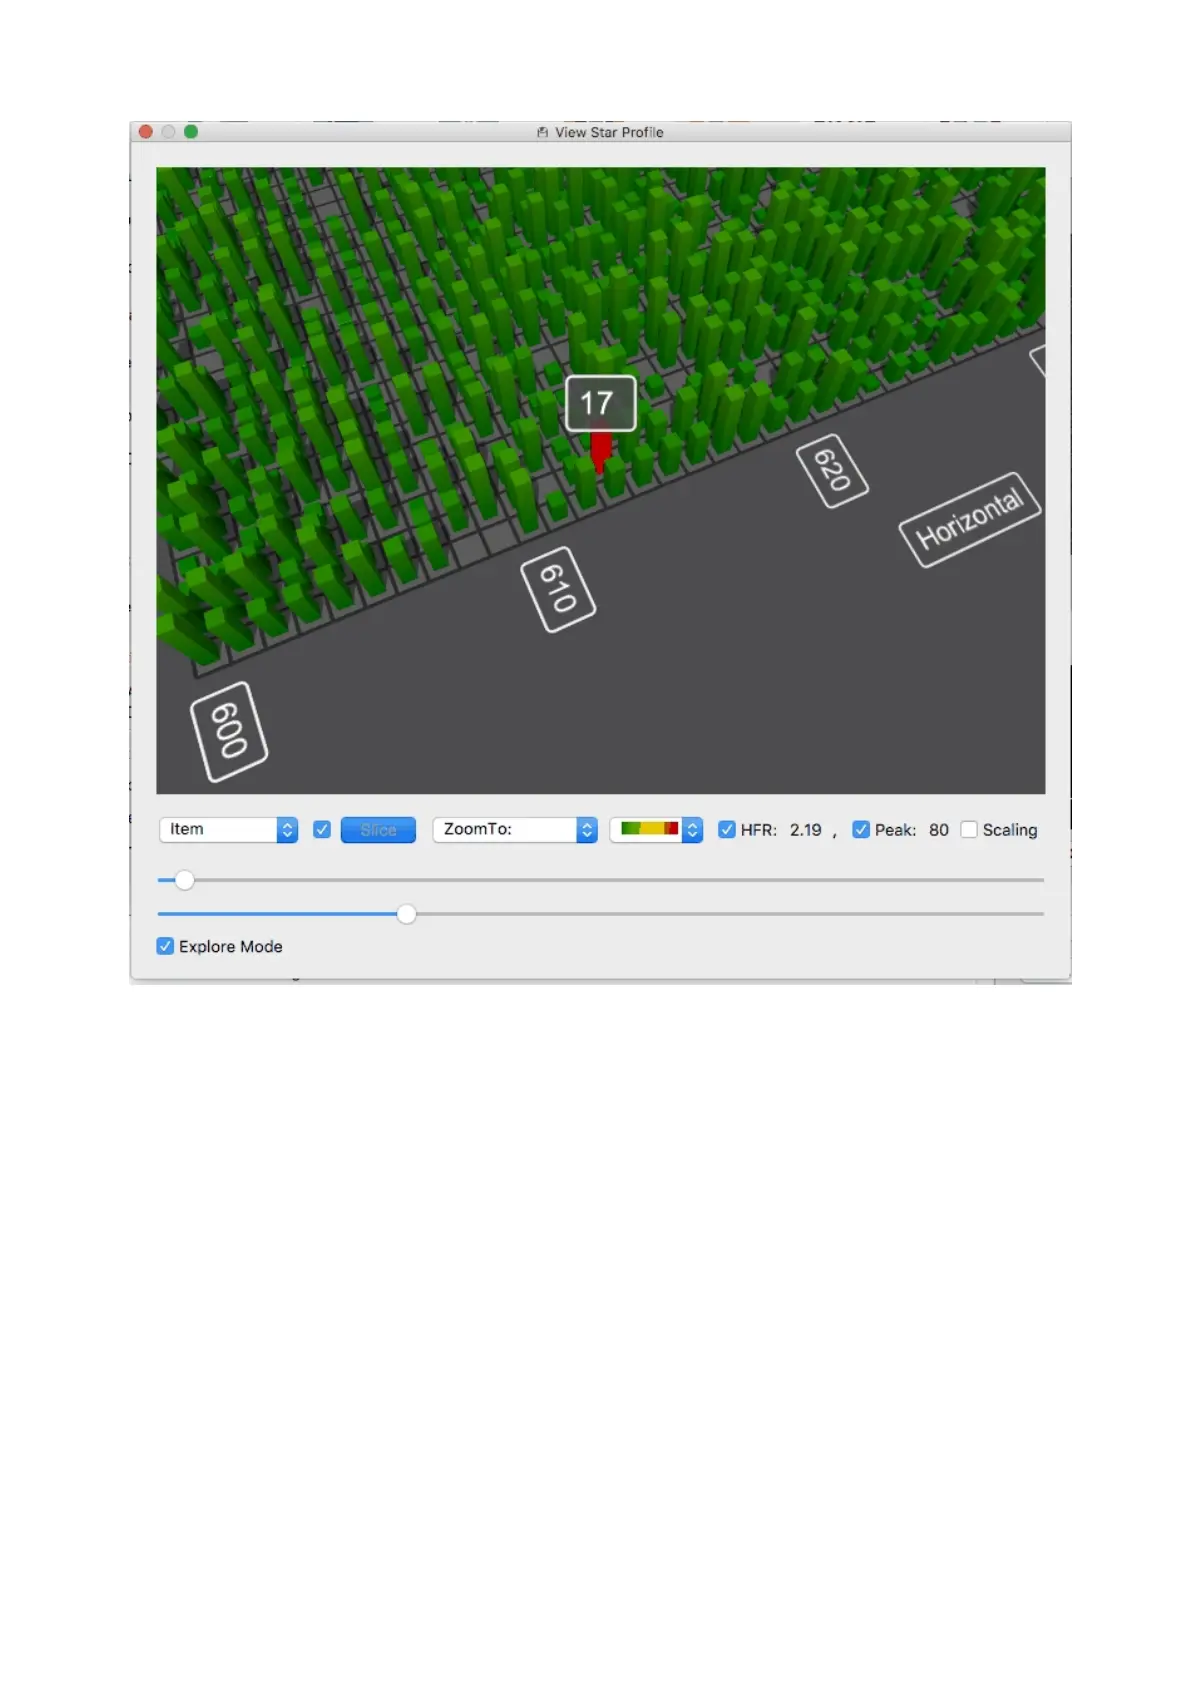
Then the user has the Zoom To combo box, which the user can use to zoom the
graph to different preset locations. Next is the combo box that lets the user
select the color scheme of the graph. Then are the HFR and the Peak checkboxes,
which will both turn on the HFR and Peak labels on each found star in the image,
but will also display one of them at the bottom of the screen. And finally comes
the Scaling checkbox, which enables the Scaling Side Panel. There are three
sliders in that panel, one to control the minimum value displayed on the graph
or “black point”, one to control the maximum value displayed in the graph or
the “white point”, and a third that is disabled by default that lets the user control
the cutoff value for data displayed on the graph.



 To Next Page