Technical Data
79
The accuracy data contains linearity, temperature, long-term drift, and
frequency.
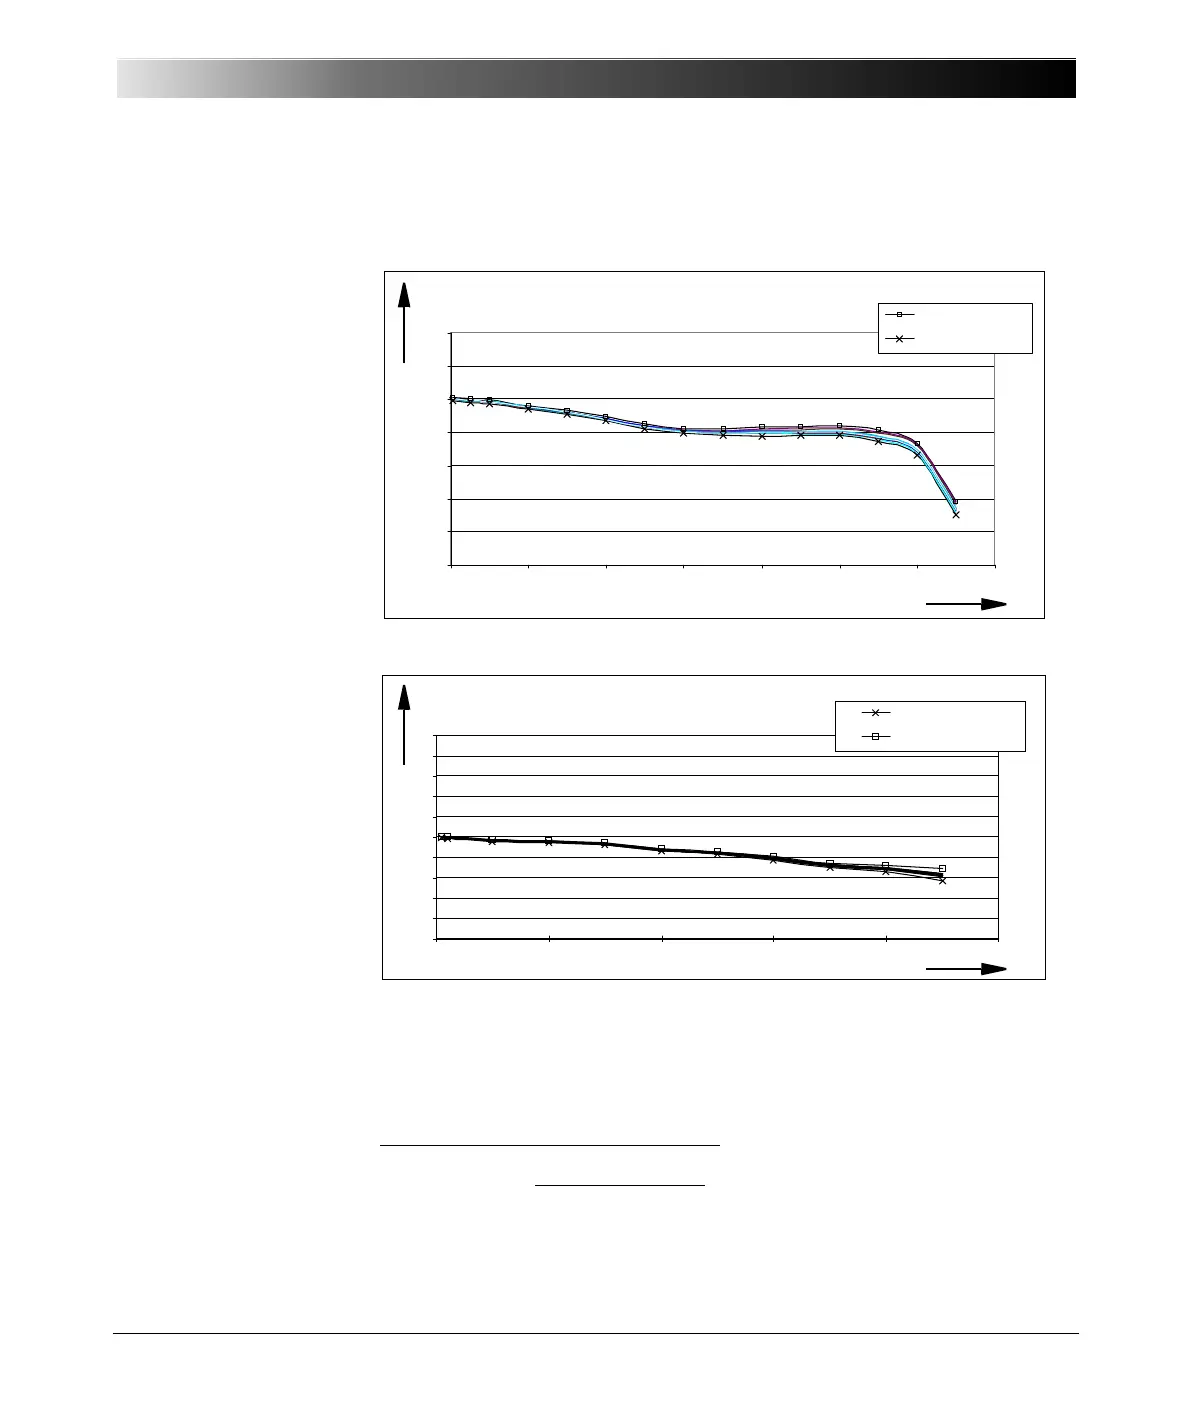
Figure 6-20:
Typical frequency
response with a sampling
rate of 28.44 kHz and an
input voltage of 70 V
1
1
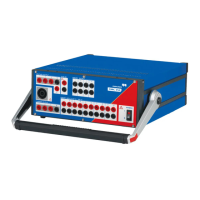
Figure 6-21:
Typical frequency
response with a sampling
rate of 9.48 kHz and an
input voltage of 70 V
1
1
a)
b) 3Sigma
max
represents the maximum of the 3Sigma values of all 10 input channels.
The 3Sigma
max
value of an analog input are determined from 50 measurement values.
Frequency Response in the 100 V Range
(SR = 28.44 kHz)
-2.5
-2
-1.5
-1
-0.5
0
0.5
1
02468101214
Frequency / kHz
Rel. Error / %
Max imum+3 Sig mamax
Minimum- 3Sigmamax
Frequency response in the 100 V range
(SR = 28.44 kHz)
Frequency in kHz
Rel. error in %
Actual - Expected
Full scale
x 100 %Relative error:
Frequency Response in the 100 V Range
(SR = 9.48 kHz)
-1
-0.8
-0.6
-0.4
-0.2
0
0.2
0.4
0.6
0.8
1
012345
Frequency / kHz
Rel. Error / /%
Minimum- 3Sigmamax
Max imu m+3Sig mamax
Frequency response in the 100 V range
(SR = 9.48 kHz)
Frequency in kHz
Rel. error in %