Section 6 Operation Interface
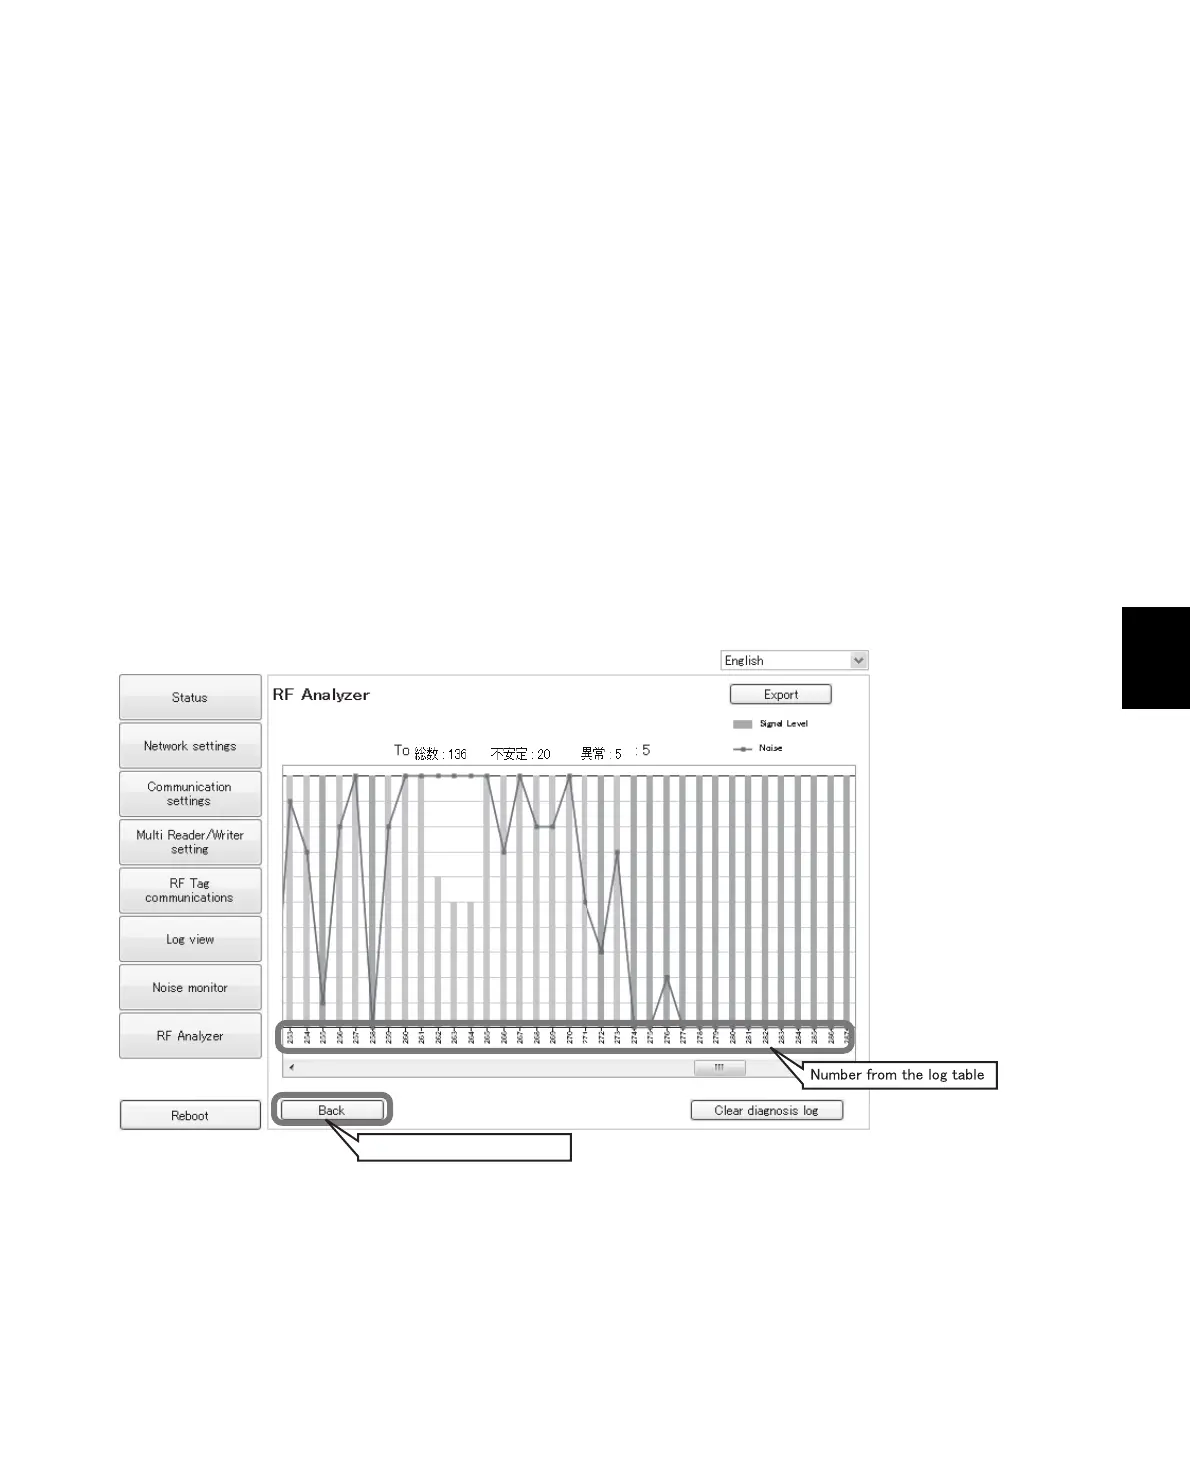
RF Analyzer Graphs
You can display time-based graphs of diagnostic log information.
This allows you to visually understand the data from communication diagnostic and quantitatively
confirm the degree of leeway in communications.
Two parameters are displayed for the graph.
1. Power Level
To communicate with RF Tags, the power levels of the Reader/Writer and RF Tags must be
sufficiently high. You can display the power levels in 10 levels from 0 to 10 on a bar graph. The higher
the value, the more leeway there is in communications. If there is sufficient communications leeway,
the level is 10. If a communication fails (i.e., if an error occurs), the level will be 0 and no bar will be
displayed. A value of 1 to 9 means that the communications leeway is low (i.e., that communications
are unstable), and the bar will be displayed in yellow. In this case, we recommend that you follow the
guidance described above and adjust the installation conditions to increase the communications
leeway as close as possible to a level of 10.
2. Noise Level
The ambient noise level around the Reader/Writer during communications with the RF Tag is
displayed in red on a broken-line graph. The lower the noise level, the better the conditions. A noise
level of 5 or higher means that the communications leeway is low (i.e., that communications are
unstable), and the bar will be displayed in yellow.
Returns you to the log table.
 Loading...