955725_4
16
On the selection page a larger Row by Row chart will be displayed. On the Navigation Pane on
the right hand side of the screen, select a different metric type to be displayed. Additional metrics
are available if you use a finger to scroll the Navigation Pane downward. Once a different metric
has been selected, press “Home” to go back to the home page. The Mini Chart will now display
the new metric.
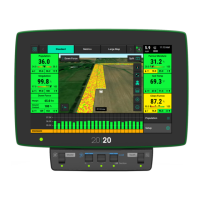
Additionally, the Mini Chart can be set to auto
scroll through different metrics. On the selection
page at the top of the Navigation Pane select the
“DMC Auto Scroll” button.
When Auto Scroll is “Enabled”, select the speed
at which the Mini Chart will scroll through
different metrics. Finally, select the metrics/
charts that will be displayed on the home screen
via the Auto Scroll.
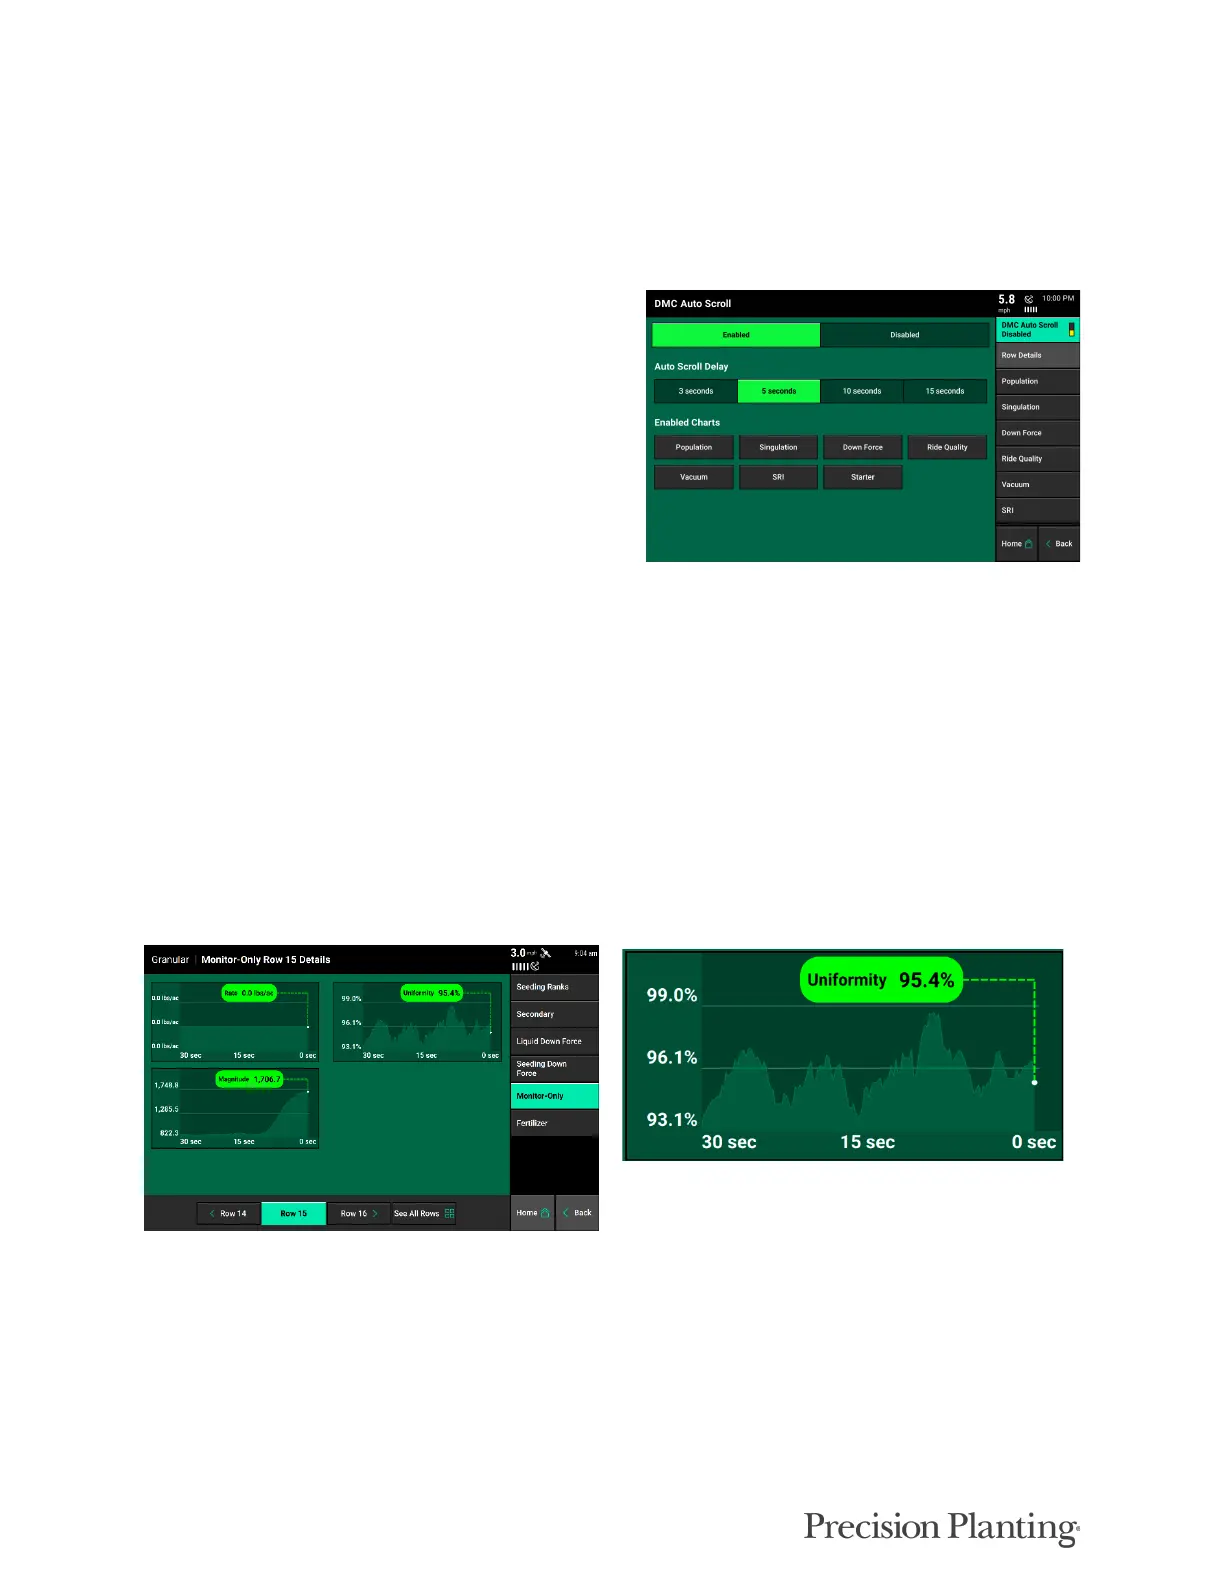
Individual Row Details
Detailed information for each Air Seeder row can also be viewed. Access the Row Details screen
by either selecting a metric box on the home screen, touching the Dashboard Mini Chart, or
selecting the metric type that is being displayed on the mini chart. Select “Air Seeder Row
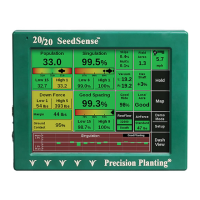
Details” on the right side of the screen. Row Details shows available metrics displayed in a graph
over the past 30 seconds of time. See example below.
The buttons showing row numbers at the bottom of the screen allow the operator to navigate to
other rows.