955725_4
15
1. Hold a finger on the legend and slide it up and down to adjust the high and low ends of the legend.
2. Tap on the legend to adjust the High & Low values, number of steps, and use the auto adjust feature.
Note: If a small map has been added to the home screen, none of the control buttons as described above
will be available.
General Mapping Principles
• All maps except for SRI (2 Hz) are mapped at 5Hz, meaning there are 5 data points mapped
for each second of time.
• Maps are mapped on a row by row basis.
• A dark line will be mapped on either side of the planter to distinguish planter passes.
• If the planter appears to be mapping incorrectly, ensure that the planter setup is correct.
• Rows that are inactive or are not collecting information on a row (for example, a row does
not have load cell installed) will not map.
• Map types can be changed at any time by selecting a different type.
• Some map types require specific Precision Planting products to be installed on the planter to
generate the information necessary to create a map.
• If the map has moved away from the tractor/seeder location, a white arrow will appear on the
edge of the map pointing to the direction the tractor/seeder is in.
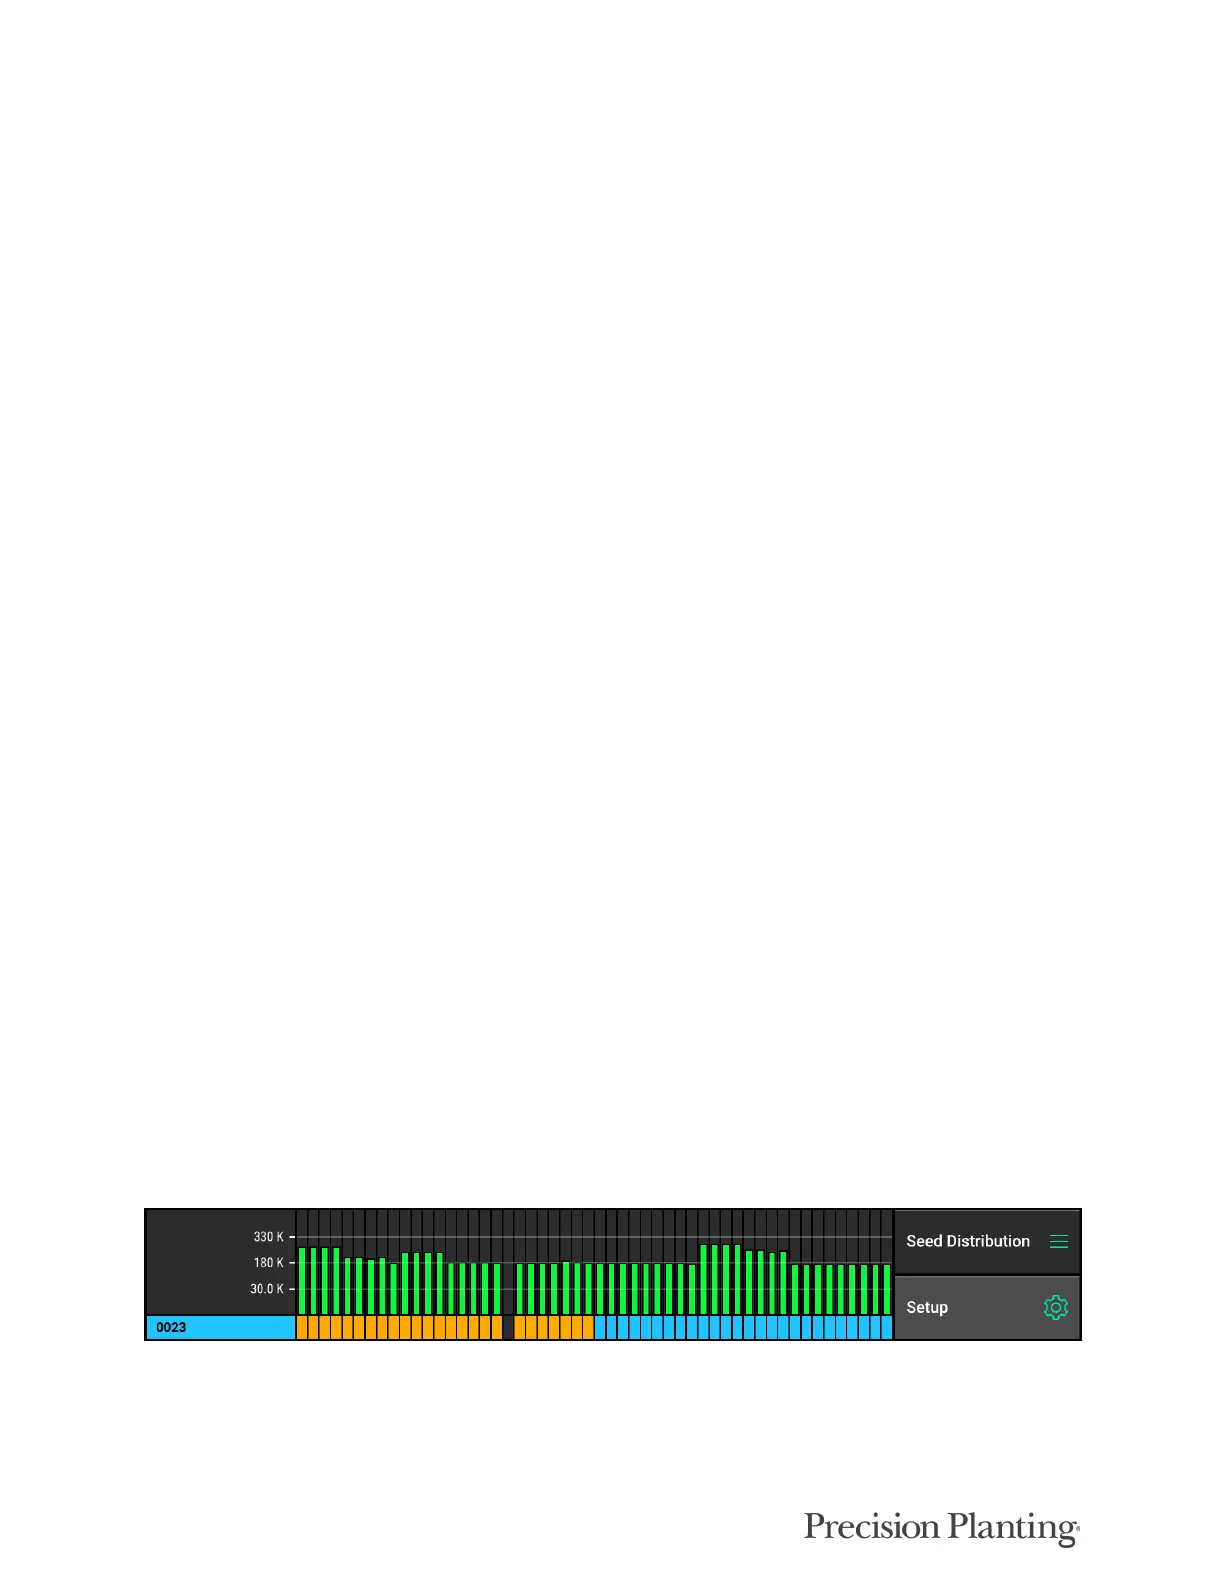
Dashboard Mini Chart
The DashBoard Mini Chart is located at the bottom of the Standard and Metric Home Screens by
default. The Mini Chart shows a bar chart for one of the measurements of the 20|20 for each row.
Rows that exceed alarm values will turn yellow while rows that exceed alert values will turn red.
Alarm and Alert values can be set in the Alerts menu as described in the Alerts Menu section
below.
Below the bar chart, the active hybrids are displayed. If multiple hybrids are active, the hybrid
name and associated color will alternate among the active hybrids every five seconds. Any row
marked in yellow instead of a hybrid color indicates a row that is currently Swathed Off.
The metric type being displayed on the Mini Chart is located over the “Setup” button. To change
the type of metric, select “Magnitude” (or the metric type displayed) above the Setup button. The
same screen can also be accessed by selecting any of the metric boxes on the home screen or
touching directly on the DashBoard Mini Chart itself.