19
Diagrams for adjusting the capacity
p [bar]
p [bar]
S [%]
S [%]
0 10 20 30 40 50 60 70 80 90 100
C [l/h]
C [l/h]
A
B
C [l/h]
C [l/h]
A
B
0 10 20 30 40 50 60 70 80 90 100
0.0
10.0
20.0
30.0
40.0
50.0
60.0
70.0
80.0
90.0
p [bar]
S [%]
C [l/h]
C [l/h]
S1Cb
S1Cb
S1Cb
A
B
0 10 20 30 40 50 60 70 80 90 100
0.0
10.0
20.0
30.0
40.0
50.0
60.0
70.0
10050
12035
12017
0.0
10.0
20.0
30.0
40.0
50.0
60.0
70.0
80.0
0.0 1.0 2.0 3.0 4.0 5.0 6.0 7.0 8.0 9.0 10.0 11.0
10050
12035
12017
0.0
20.0
40.0
60.0
80.0
100.0
120.0
140.0
20.0
40.0
60.0
80.0
100.0
120.0
140.0
160.0
0.0
1.0 2.0 3.0 4.0 5.0 6.0 7.0
04120
04084
07042
0.0
160.0
04120
04084
07042
07065
10044
10022
0 1.0 2.0 3.0 4.0 5.0 6.0 7.0 8.0 9.0 10.0
0.0
10.0
20.0
30.0
40.0
50.0
60.0
70.0
80.0
90.0
07065
10044
10022
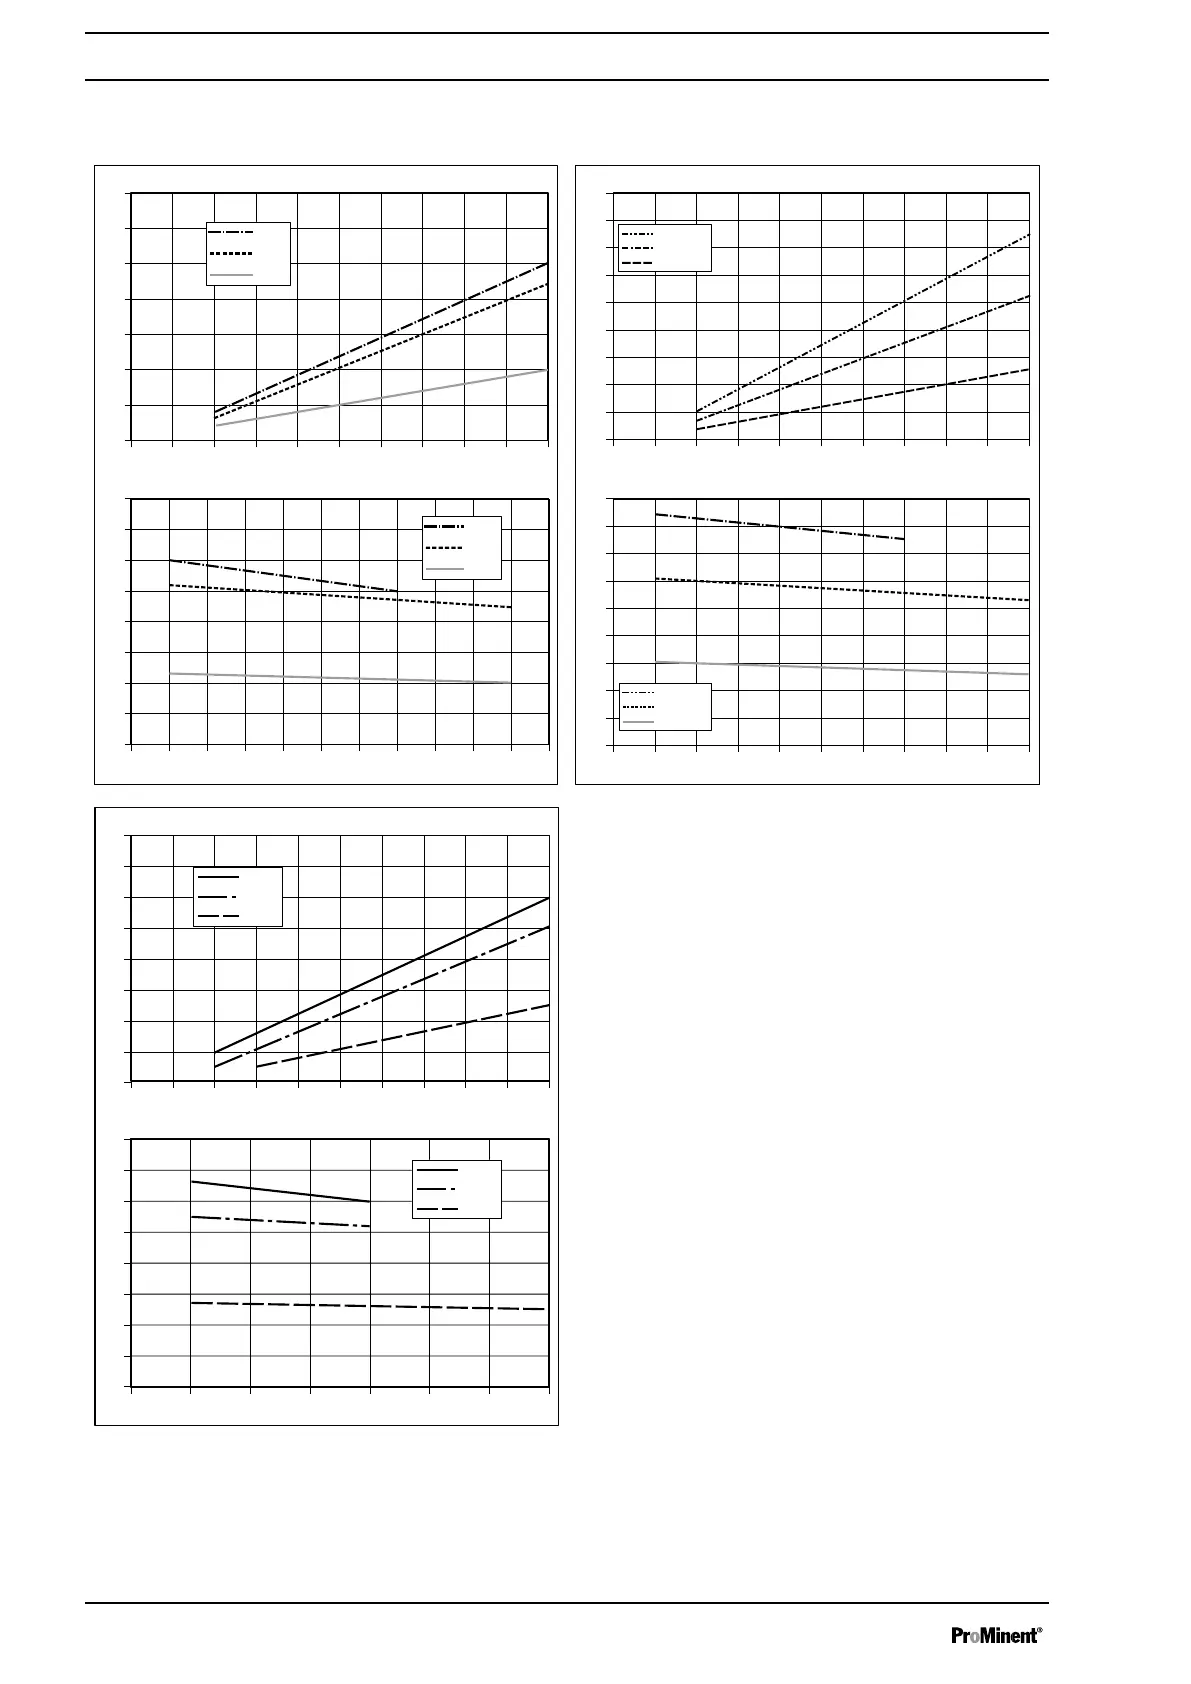
Fig. 44: A) Capacity C at minimum back pressure dependent on the stroke length s. B) Capacity C dependent on the
back pressure p.
Diagrams for adjusting the capacity
94
 Loading...