60
WARNING: This manual DOES NOT replace an adequate diving training !
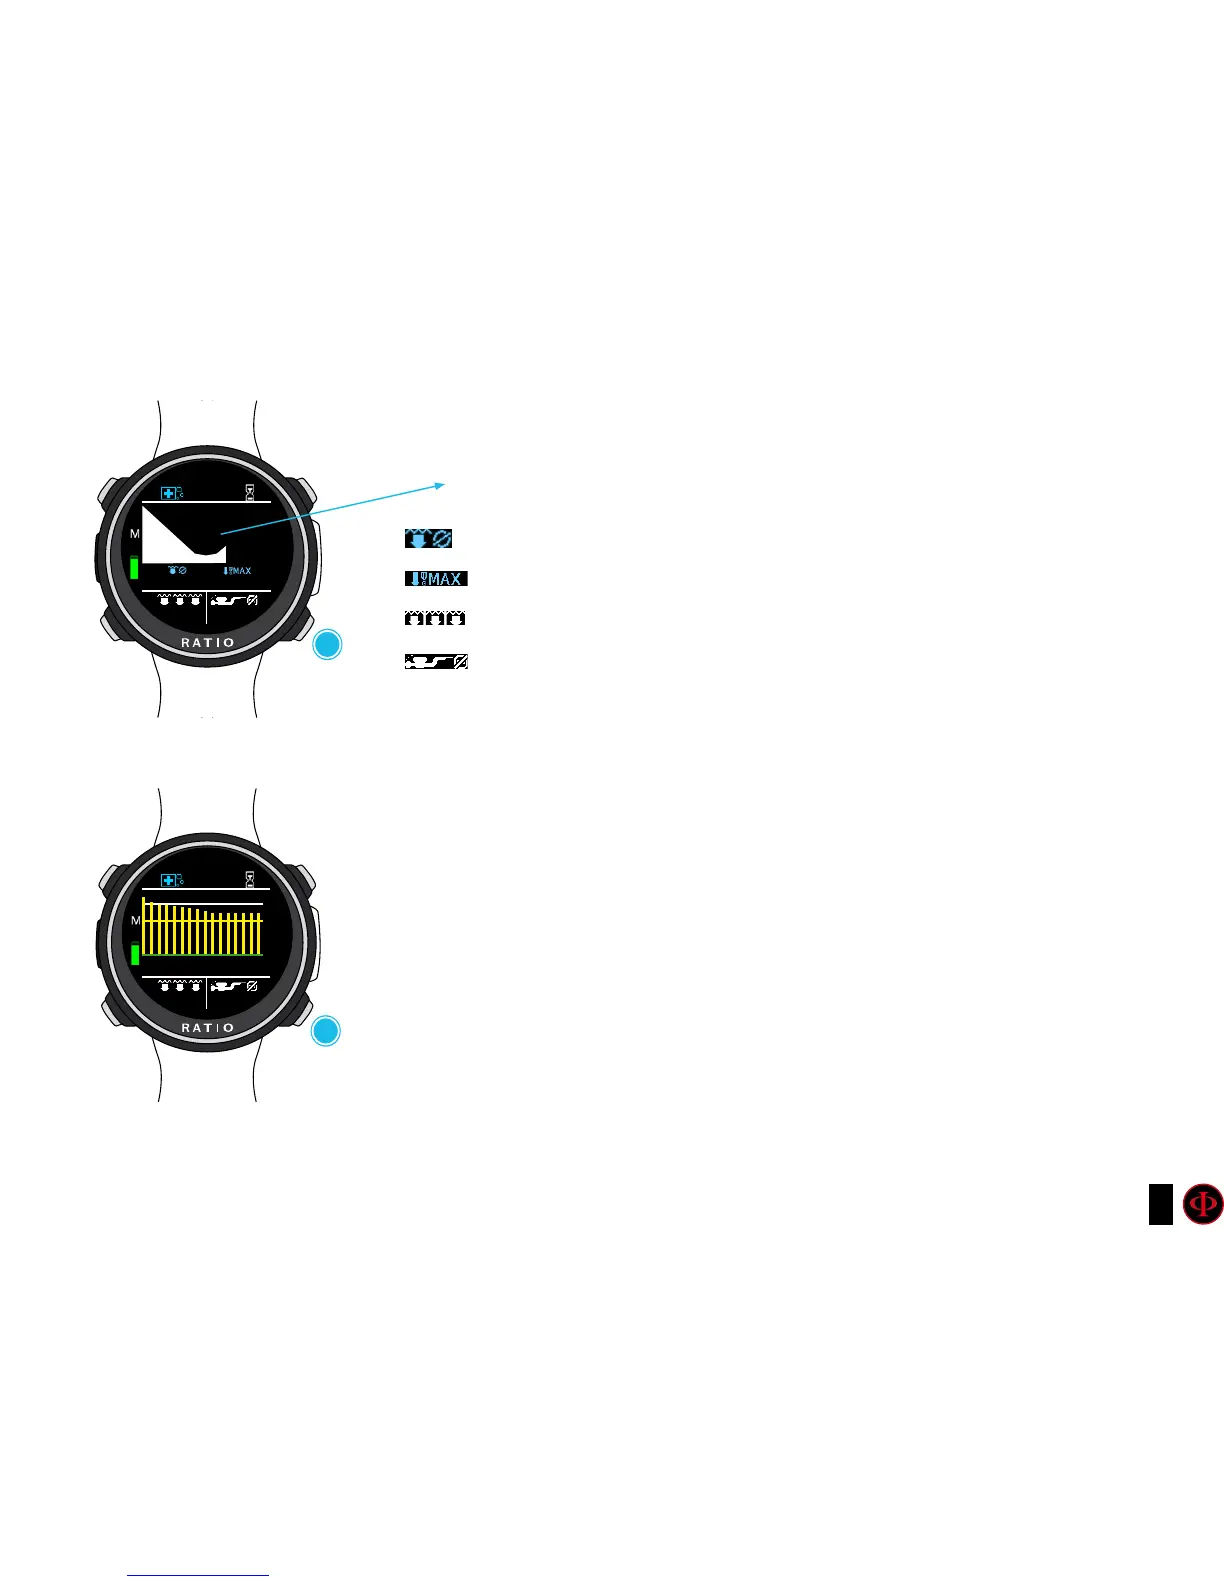
Current dive’s prole:
Graphic Prole: Real time graphic profile
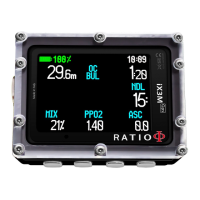
Tissues saturation when diving:
The diagram represents the 16 tissues which are taken into consideration by the
two decompressive algorithms (BUL or VPM).
The yellow lines represent the nitrogen levels. (Higher value is shown in yellow)
The green lines represent the helium levels (if present) (Higher value is shown in green)
The white line represents the environment pressure in the surface at the dive’s
beginning.
The different tissues’ saturation, represented by the yellow/green lines, represents
the inertial partial pressure in comparison to the environment pressure on the
surface .
In case of deco, the “pilot” tissue of that precise moment is highlighted by a red
rectangle .
5.13
995.2
53 0
5.13
4520.2
14.8
29.2
Average Depth
MAX Depth
Current Depth
NDL (or deco information if in deco)
next
next
D
D