3.Centerline—Thesolidlinerepresentsthecenterlineofyourvessel.left
ofthecenterlinerepresentsthewater
,objectsandbottomtotheport
sideofyourvessel,rightofthecenterlinerepresentsthestarboardside.
4.Turbulentwater—turbulenceinthewatercausedbysuchthingsas
vesselwakecanproduceasonarreturnduetotheaerationinthewater.
5.Waterdepth—Whenusingaseparatedepthtransducercurrentdepth
canbedisplayedinadataoverlay.
6.Vegetation—Examplesofvegetationgrowth(e.g:trees)onthebottom.
7.Baitball—Exampleofabaitballatanapproximatedistanceof18.5
ftfromyourvessel.
8.Structure—Exampleofbottomstructure.Underwaterstructuressuch
aspipelines,piersandotherlargesolidstructuresmaycauseanareaof
shadowdirectedawayfromyourvessel’sdirection.
9.Vesseldirection—Vesseldirectionoftravel.Thesonarimagewillscroll
fromtoptobottomasyourvesselmoves.
10.Bottom—Solidmassindicatingthebottom,usingthedefaultcolor
palettethebottomiscoloredcopper.Itmaybepossibletoidentify
thetransitionofbottommaterial(e.g.:whereanareaofmudmeetsan
areaofgravel).
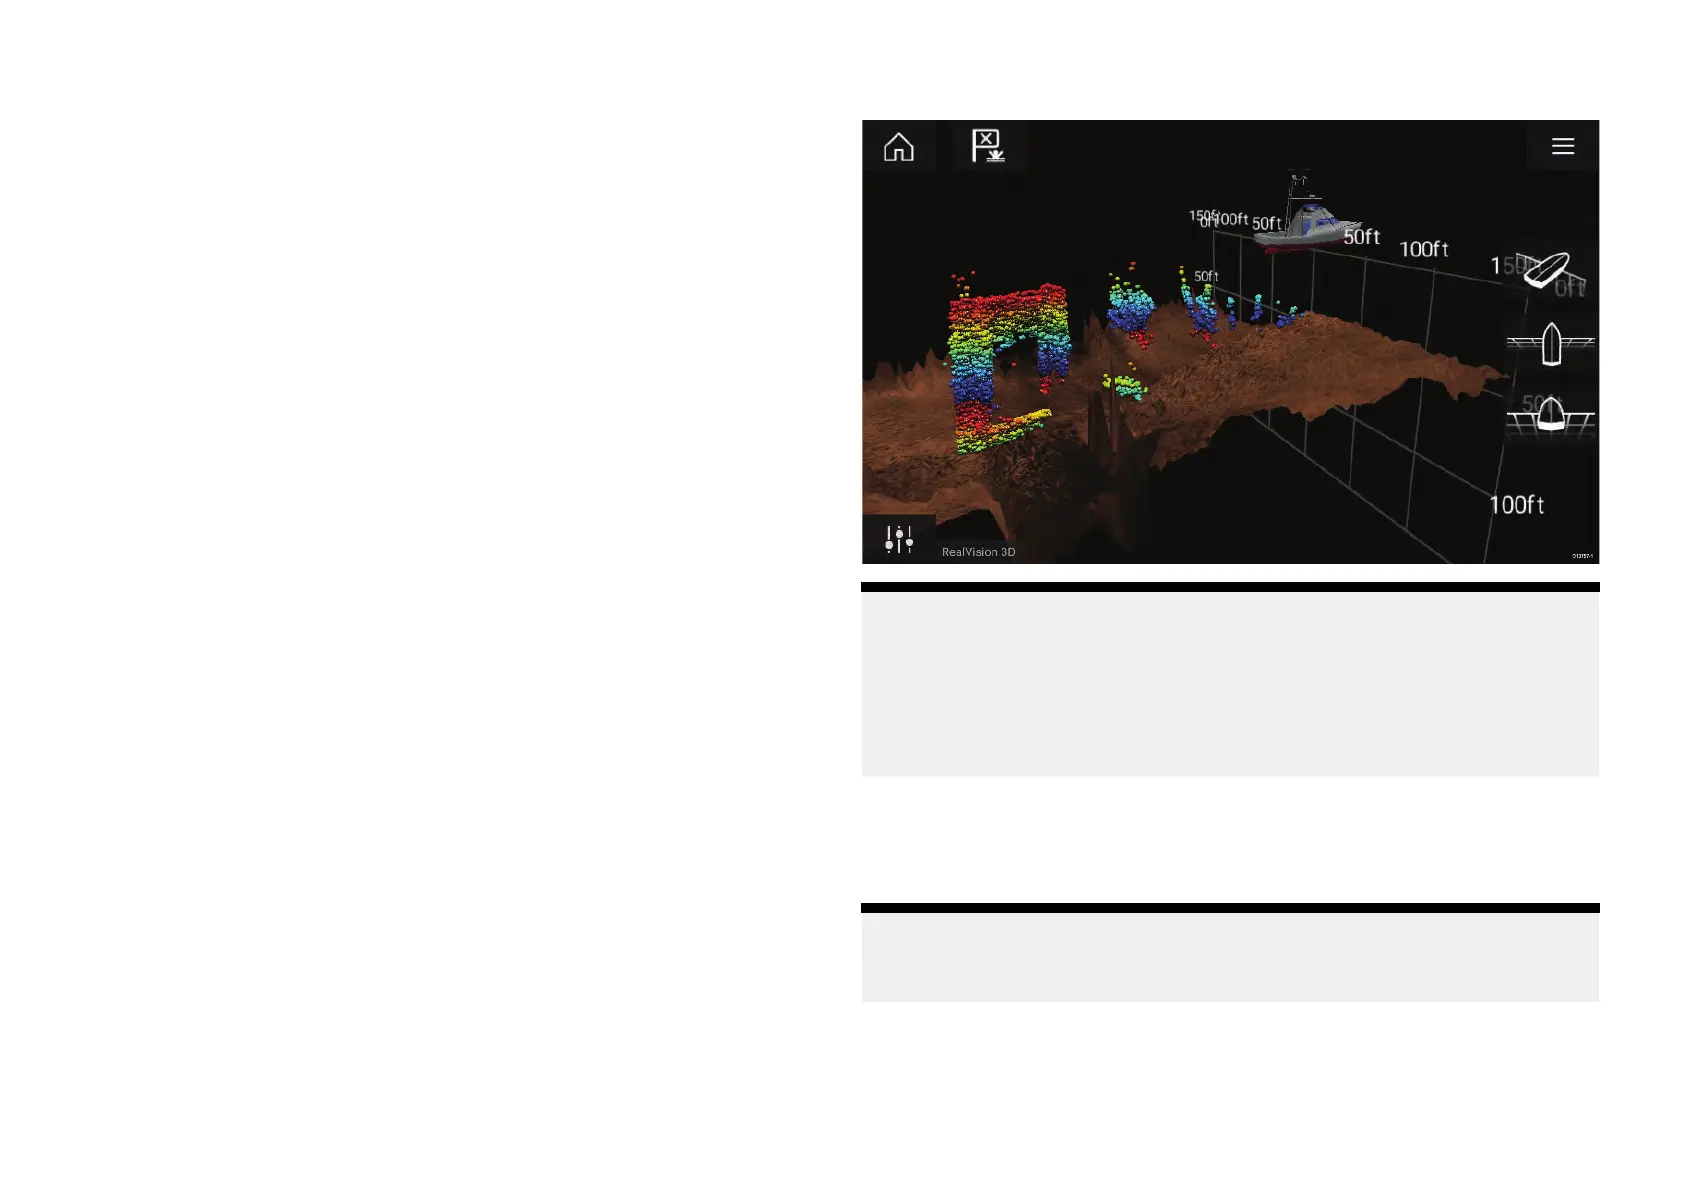
RealVision™3Doverview
RealVision™3DtransducerscombineDownVision™,SideVision™,high
frequencyCHIRPSonar,andRealVision™3Dtodeliverlife-like3Dsonar
imagery.
RealVision™3Dprovidesatrue,easy-to-understandviewofbottom
topography,debris,andfish.
RealVision™3Dscreenexample
Note:
The“Depth”figureshownintheillustrationaboveassumesthatyou
haveadeviceinyoursystemthatprovidesdepthdata.Pleasebe
awarethatnotalltransducersand/orsonarmodulessupportdepth
sensing.Formoreinformation,refertothelatestspecificationsand
documentationavailableforyourparticularproductsontheRaymarine®
website(www.raymarine.com).
8.2Sonarchannelrange
Rangecapabilitiesoftheavailablesonarchannelsareshownbelow.
Note:
Statedrangeareforoptimumconditionsandaredependentupon
connectedtransducer.
96