Roche Diagnostics
A-100 Operator’s Manual · Version 3.1
4Software Cedex Bio System
Key screens
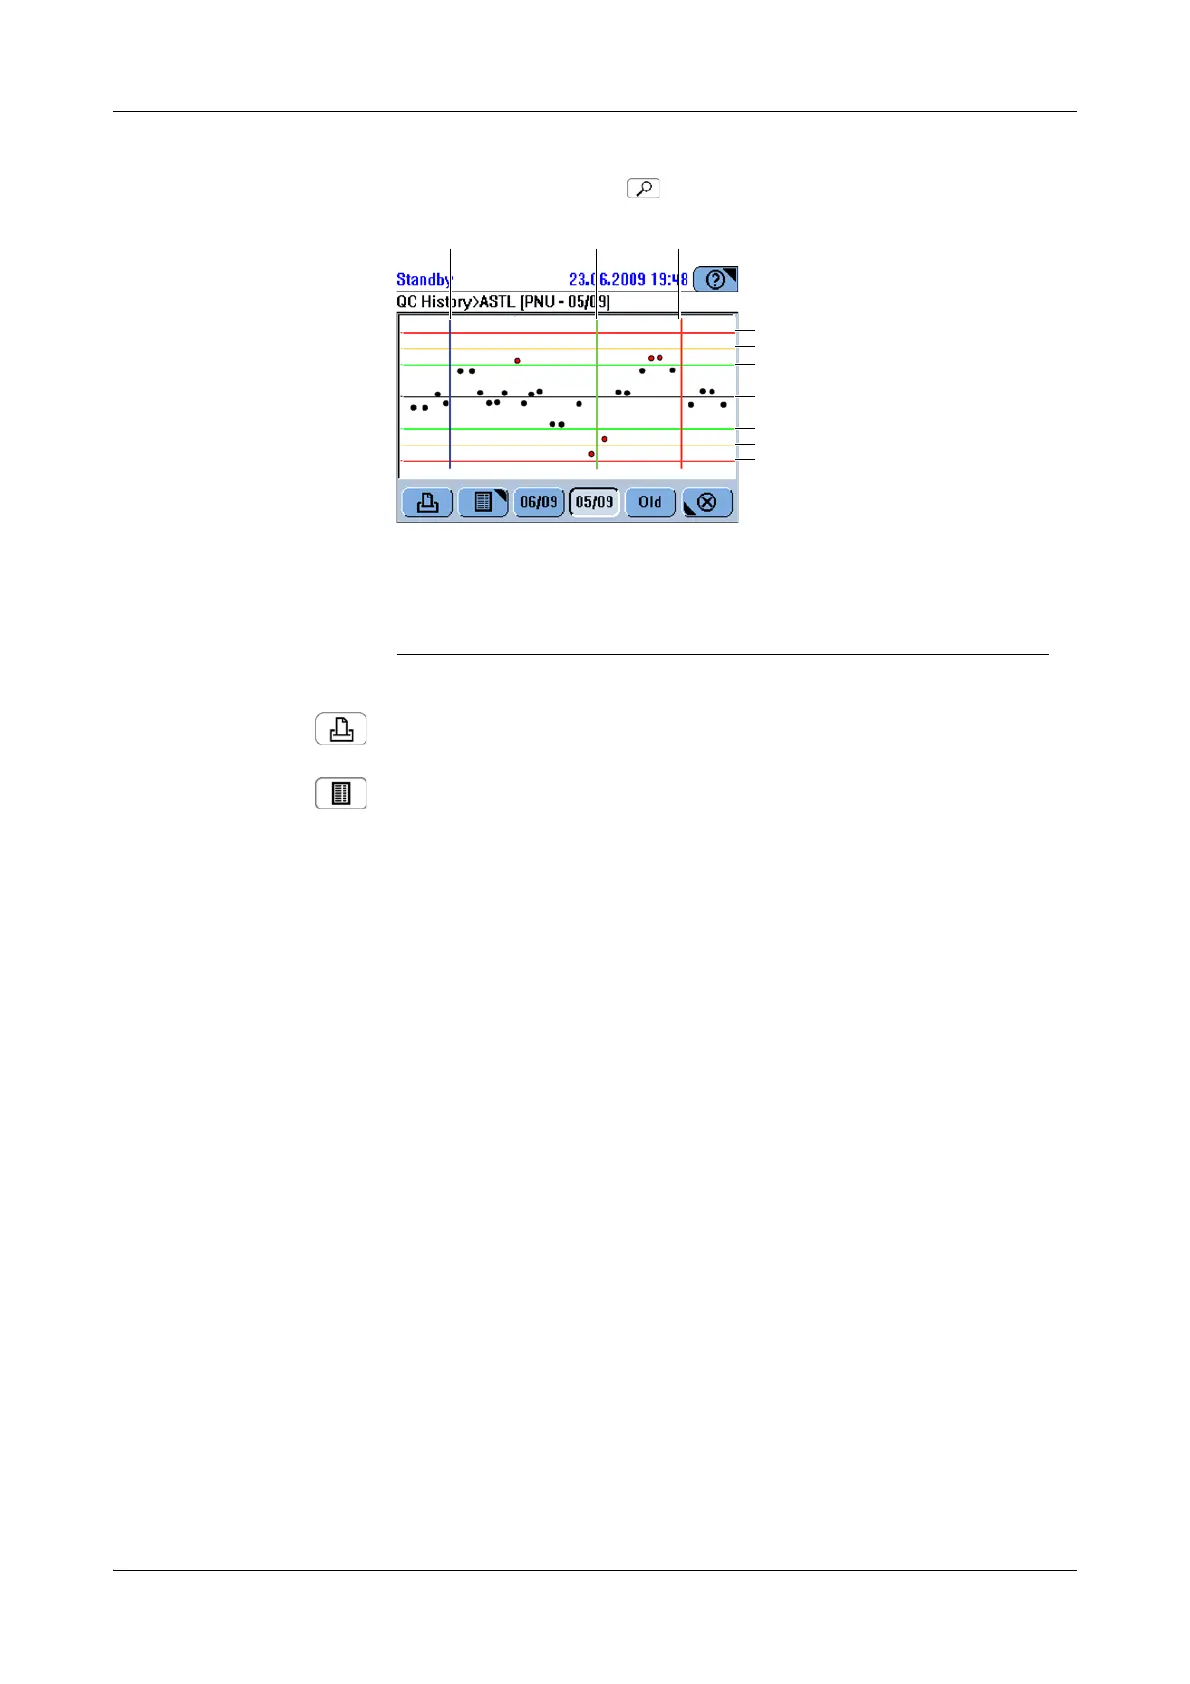
f Workplace > QC History >
Print the graphic.
Display the results in a table.
The results are sorted chronologically, relevant events (QC lot change, reagent set
change, QC target value change) precede the results.
Month button Display the results of the month indicated on the button.
Old Display the results generated before the beginning of the previous month.
A Calibrator lot change
B Reagent set change
C QC target value change
D +3s
E +2.5s
F +2s
G Mean value
H -2s
I -2.5s
J -3s
Figure A-65 QC history graphic