Roche Diagnostics
Operator’s Manual · Version 3.1 B-75
Cedex Bio System 5 Daily operation
Performing QC
2
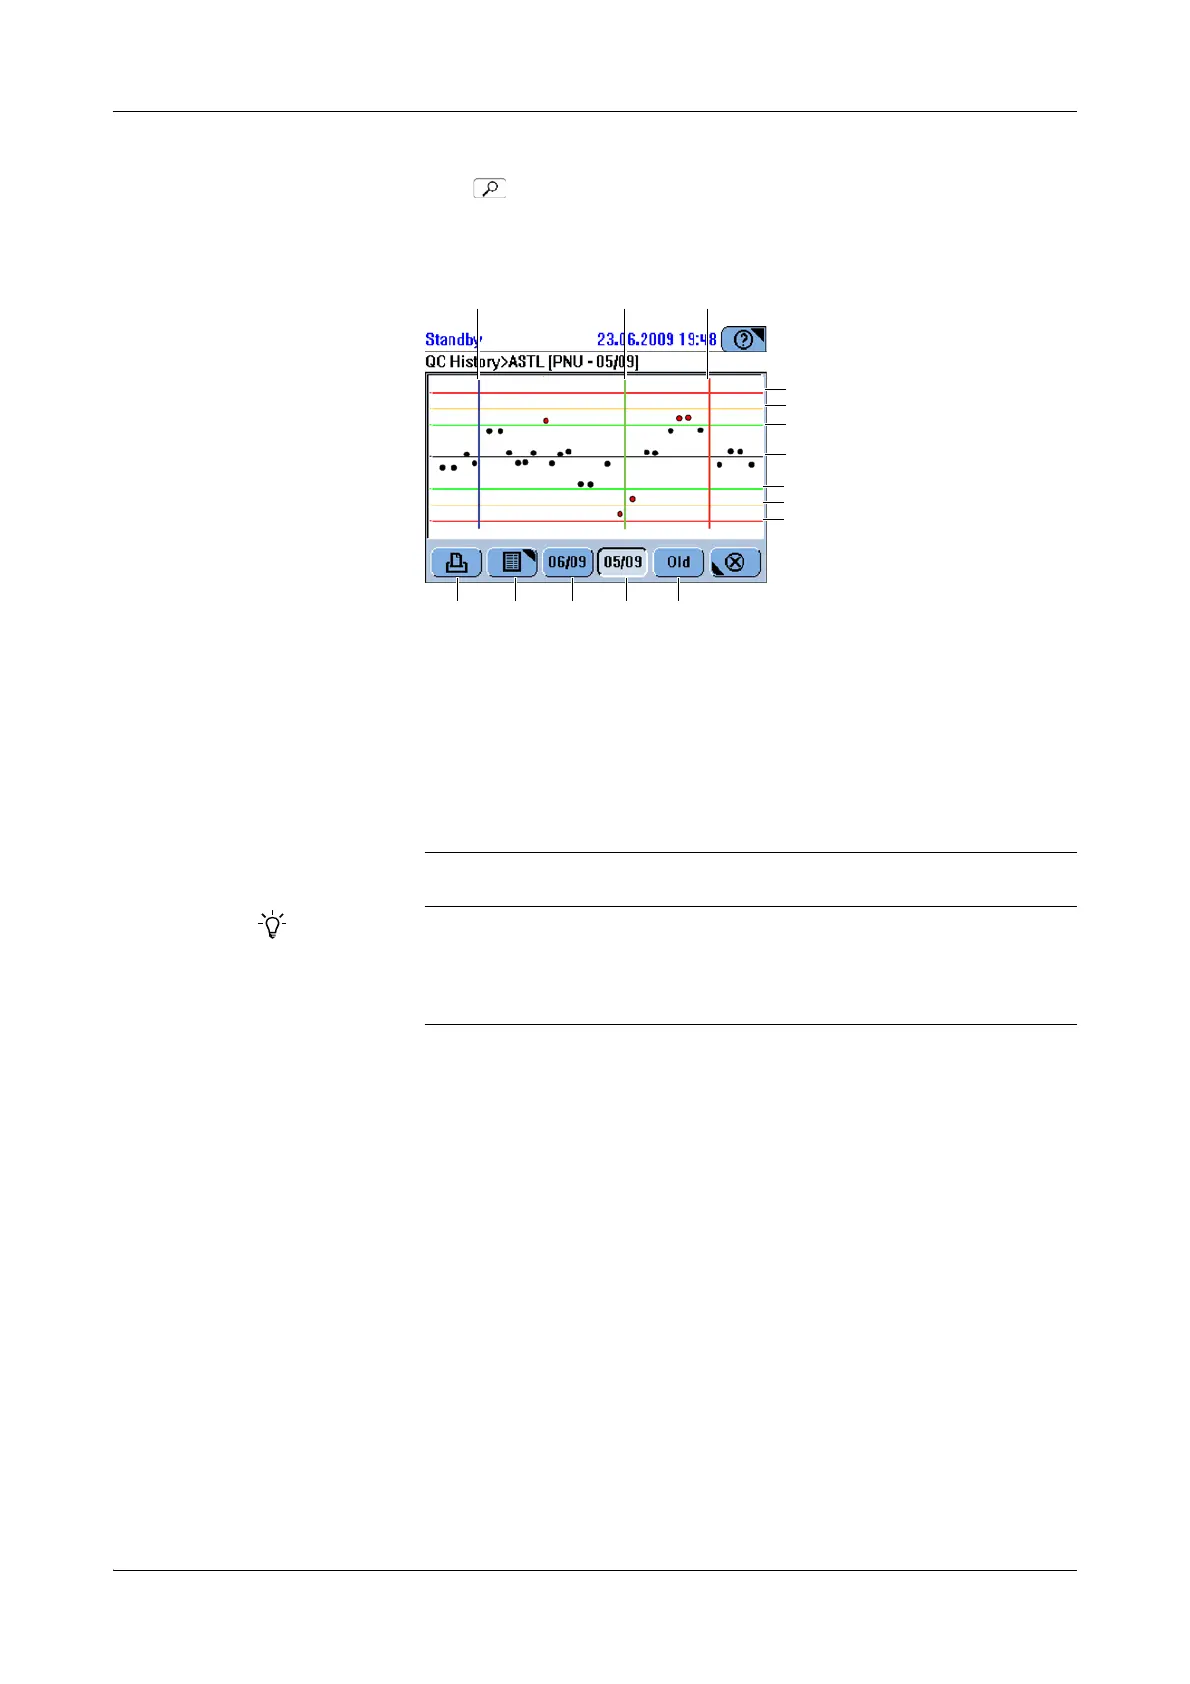
Press .
A graphic is displayed that shows either the QC results for the current or the
previous month, or those generated before the previous month.
A Calibrator change
B Reagent set change
C QC target value change
D +3s
E +2.5s
F +2s
G Mean value
H -2s
I -2.5s
J -3s
K Press to print the graphic
L Press to display the results in a table
M Press to display the results of the previous
month
N Press to display the results of the current
month
O Press to display the results that were gen-
erated before the last month
Figure B-28
o The date format in the month selection buttons is always month/year.
o Ignored QC results are not displayed in the graph, but they are included in the QC
History printout. Such results are marked with "I" at the end.
o Ignored QC results are not taken into account for QC history statistics.