29
© Rodenstock GmbH
Status: September 2023
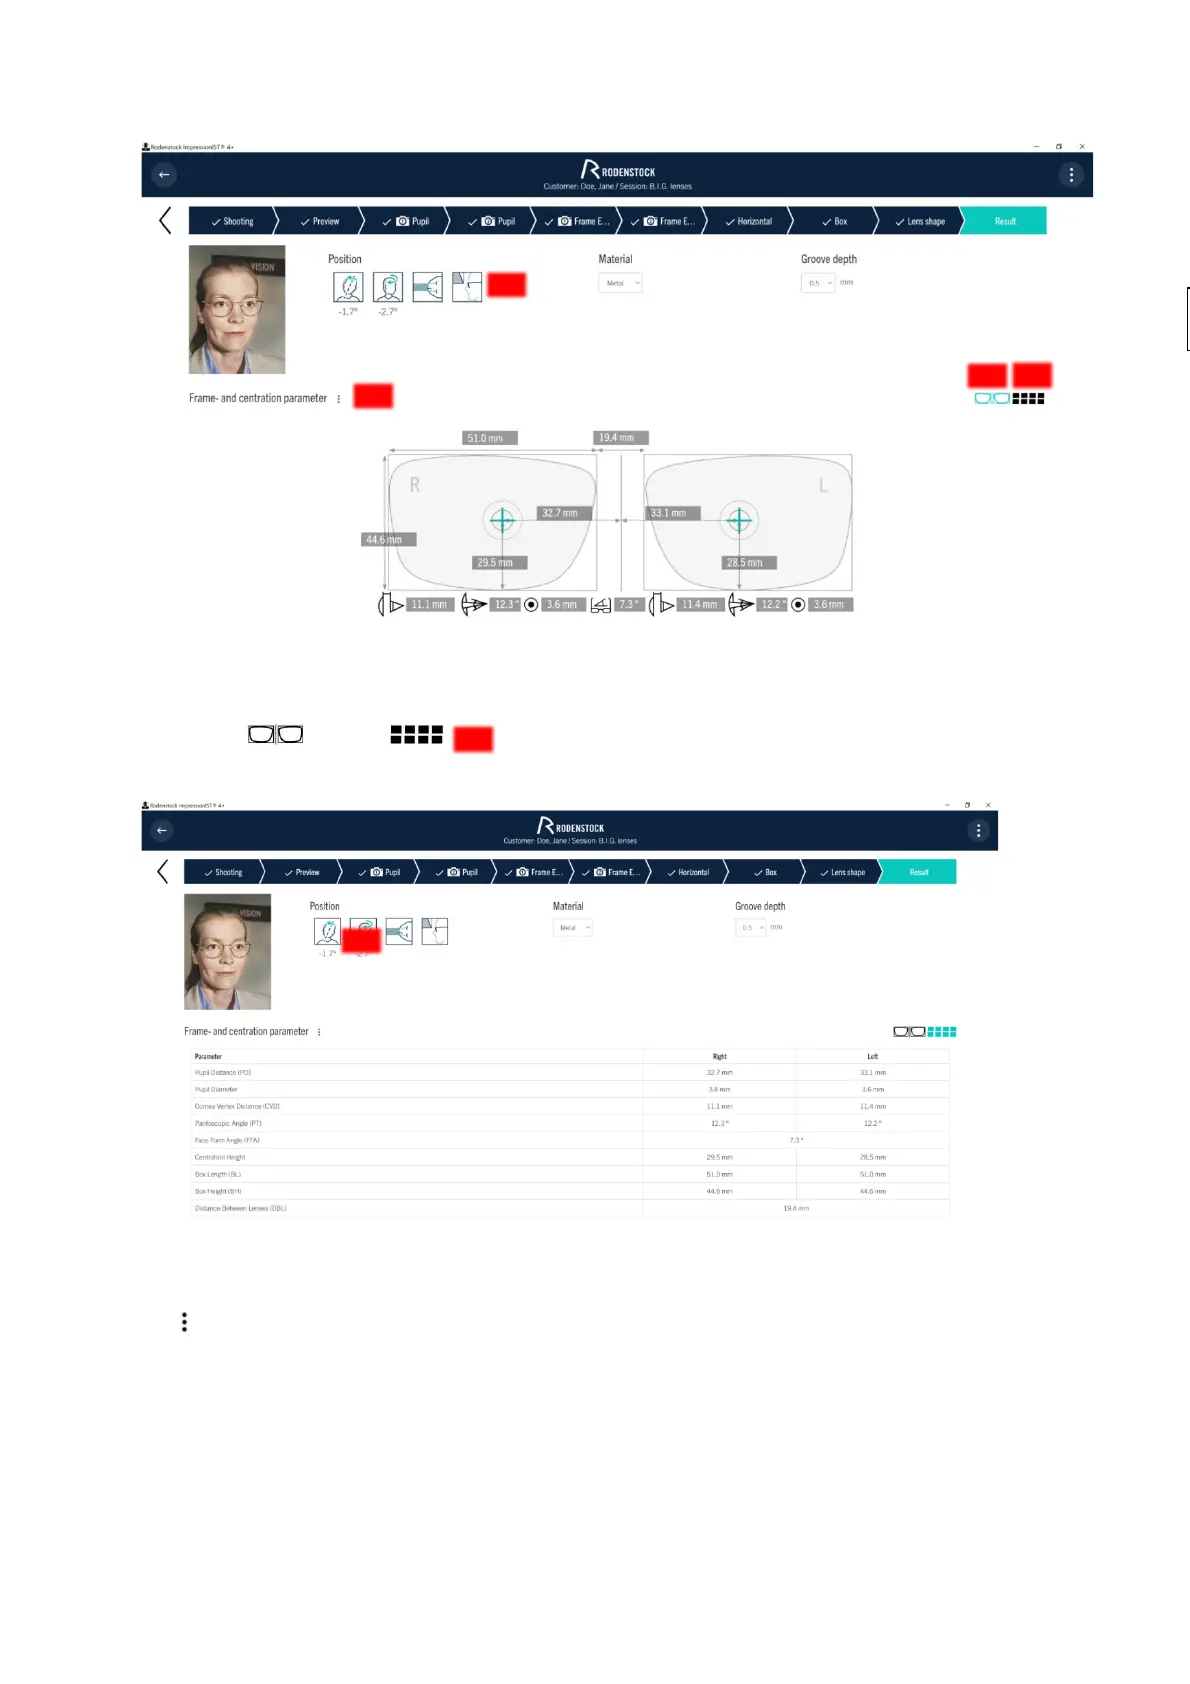
Figure 4-16: Display of results of parameter
With the icon and you can switch between the result display in box measure (Figure
4-16), or the tabular form (Figure 4-17).
Figure 4-17: Tabular presentation of the results of the parameters
Via next to frame and centering parameters , the determined individual parameters can be displayed,
printed and/or saved via a PDF report.
When using the ImpressionIST® Windows application, a desired application for the export (e.g. export to Winfit)
can also be configured via the Settings of the application.
All determined parameters are subjected to a plausibility check.
Conspicuous values are marked with a colored icon (Figure 4 18). By clicking on this icon, a corresponding
explanation can be called up. The explanation describes all the deviations determined.



 To Next Page