SPA-100 OPERATION MANUAL
22 / 67
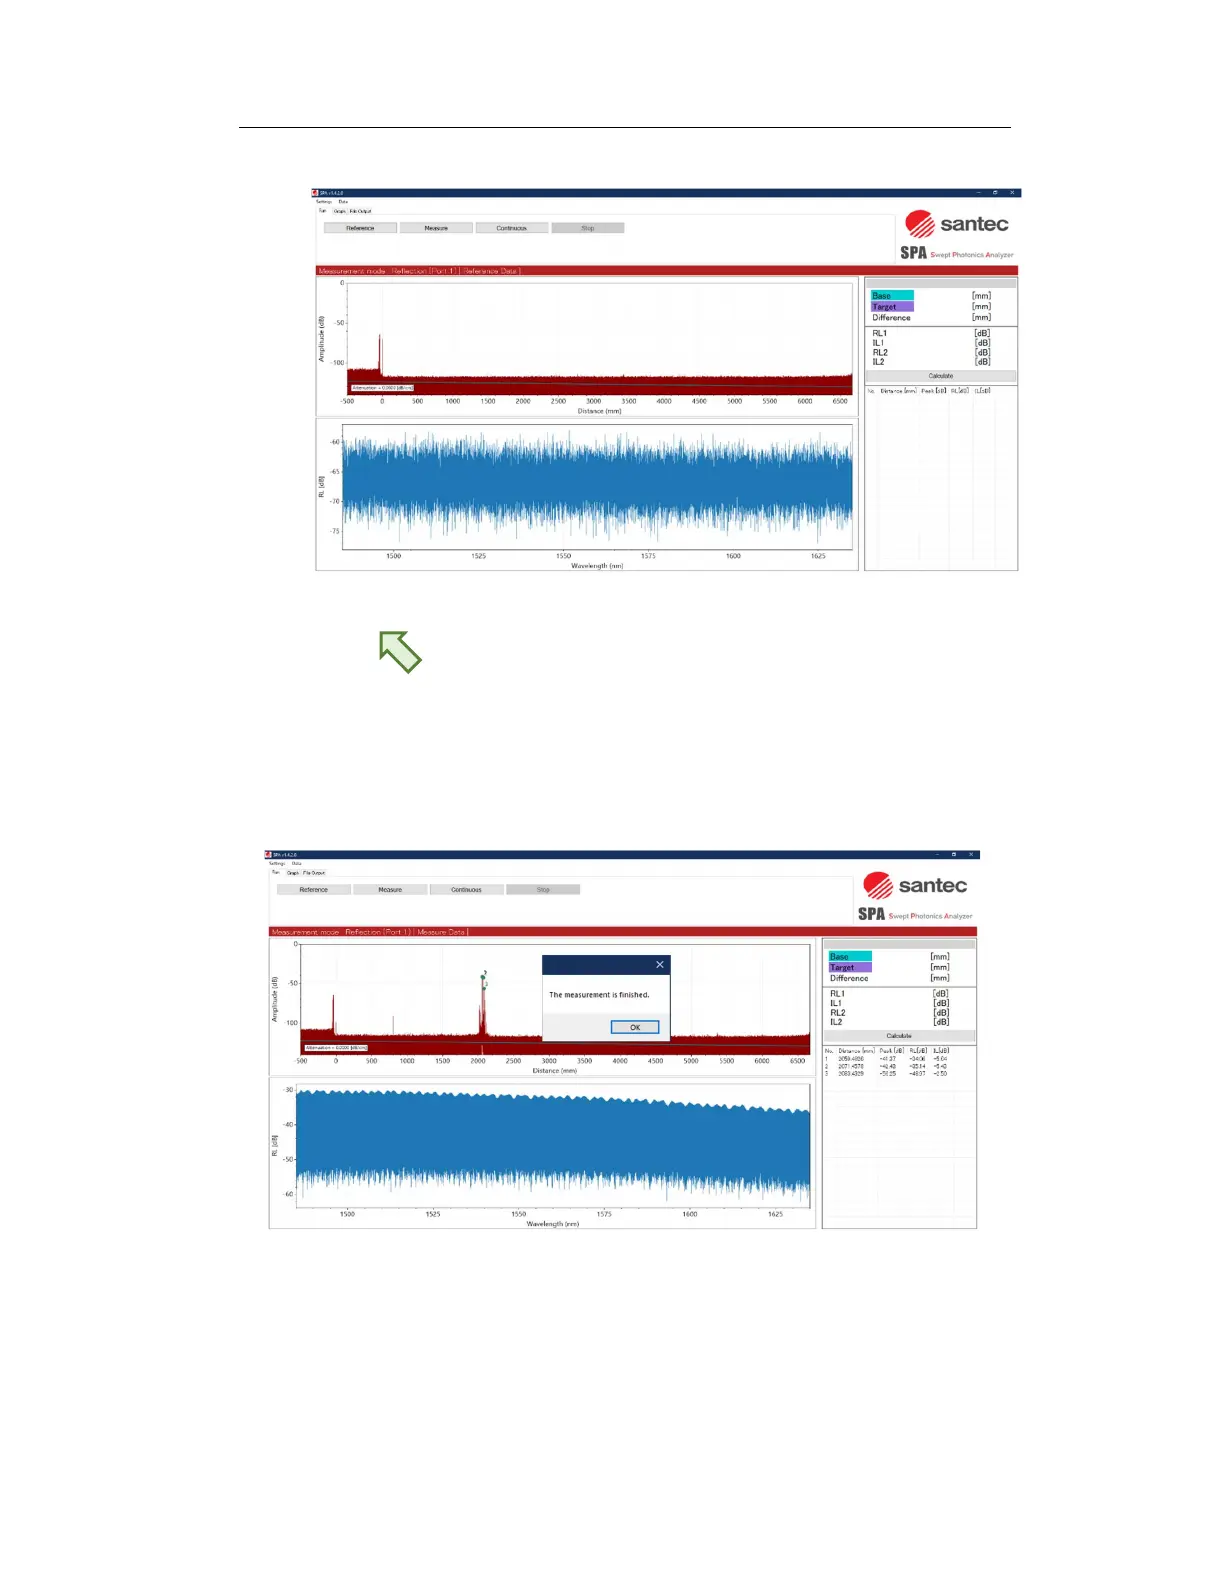
6. Click the "Measure" button to start the measurement.
Figure 6-10
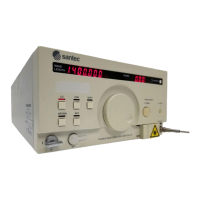
7. After the measurement Figure 6-11 displayed. The upper graph shows the
reflection intensity relative to the distance from the end face of the
measurement port. The distance of the abscissa axis is expressed in optical
distances. In addition, the wavelength-dependent characteristics of the
reflection intensity are displayed in the lower graph.
Figure 6-11