SPA-100 OPERATION MANUAL
36 / 67
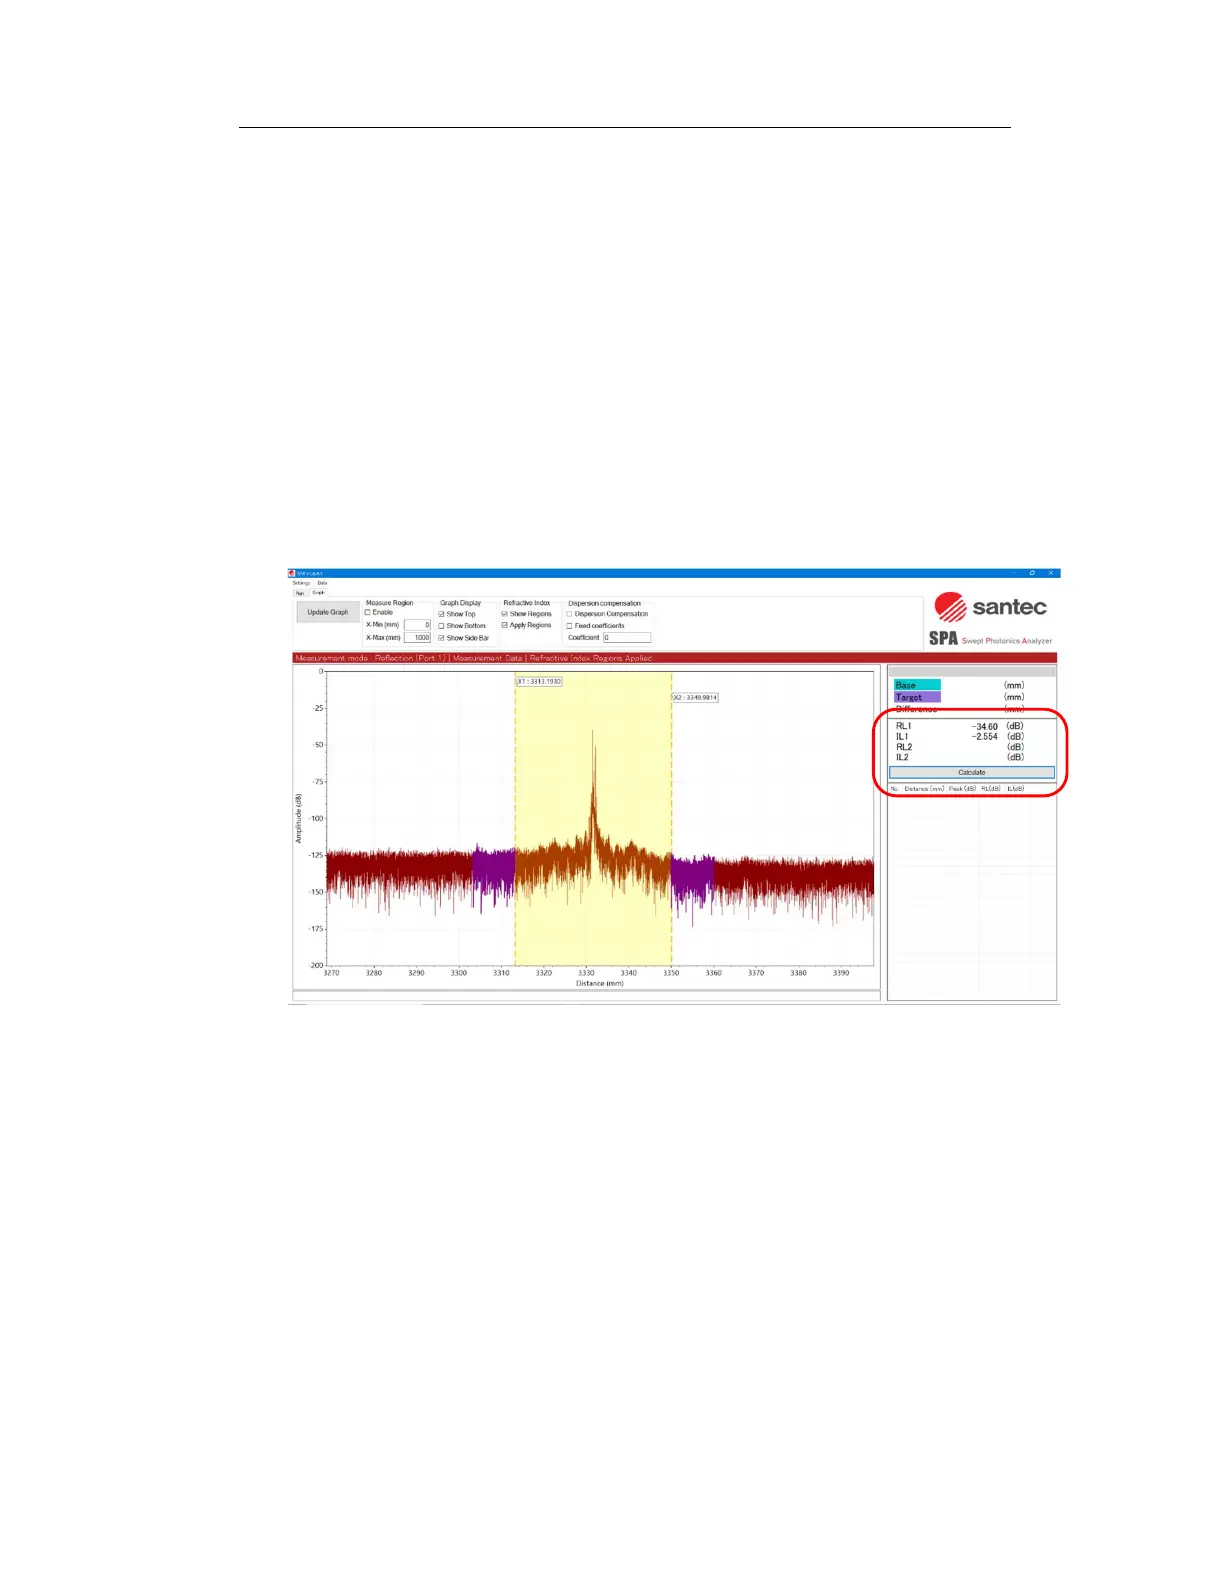
Figure 6-29
3. Drag the dashed line to adjust its position and width so that the peak of
the reflection point falls within the yellow area displayed on the graph. If the
distance between the peaks is far apart, stable measurement can be
achieved by setting the region width to about 5 mm.
4. Click the "Calculate" button on the right side of the graph to display the
return loss (RL1) and insertion loss (IL2) calculated for the selected area.
The yellow area on the graph is the area to be integrated in the RL
calculation, and the purple area is the area used for the IL calculation.
Figure 6-30
5. Using the same procedure, you can calculate RL and IL for two peaks at
the same time. Displayed on RL2 and IL2.
This function cannot accurately measure when the RL level reaches the
system noise floor or when the difference between the before and after
levels is smaller than the noise level variation.