SPA-100 OPERATION MANUAL
42 / 67
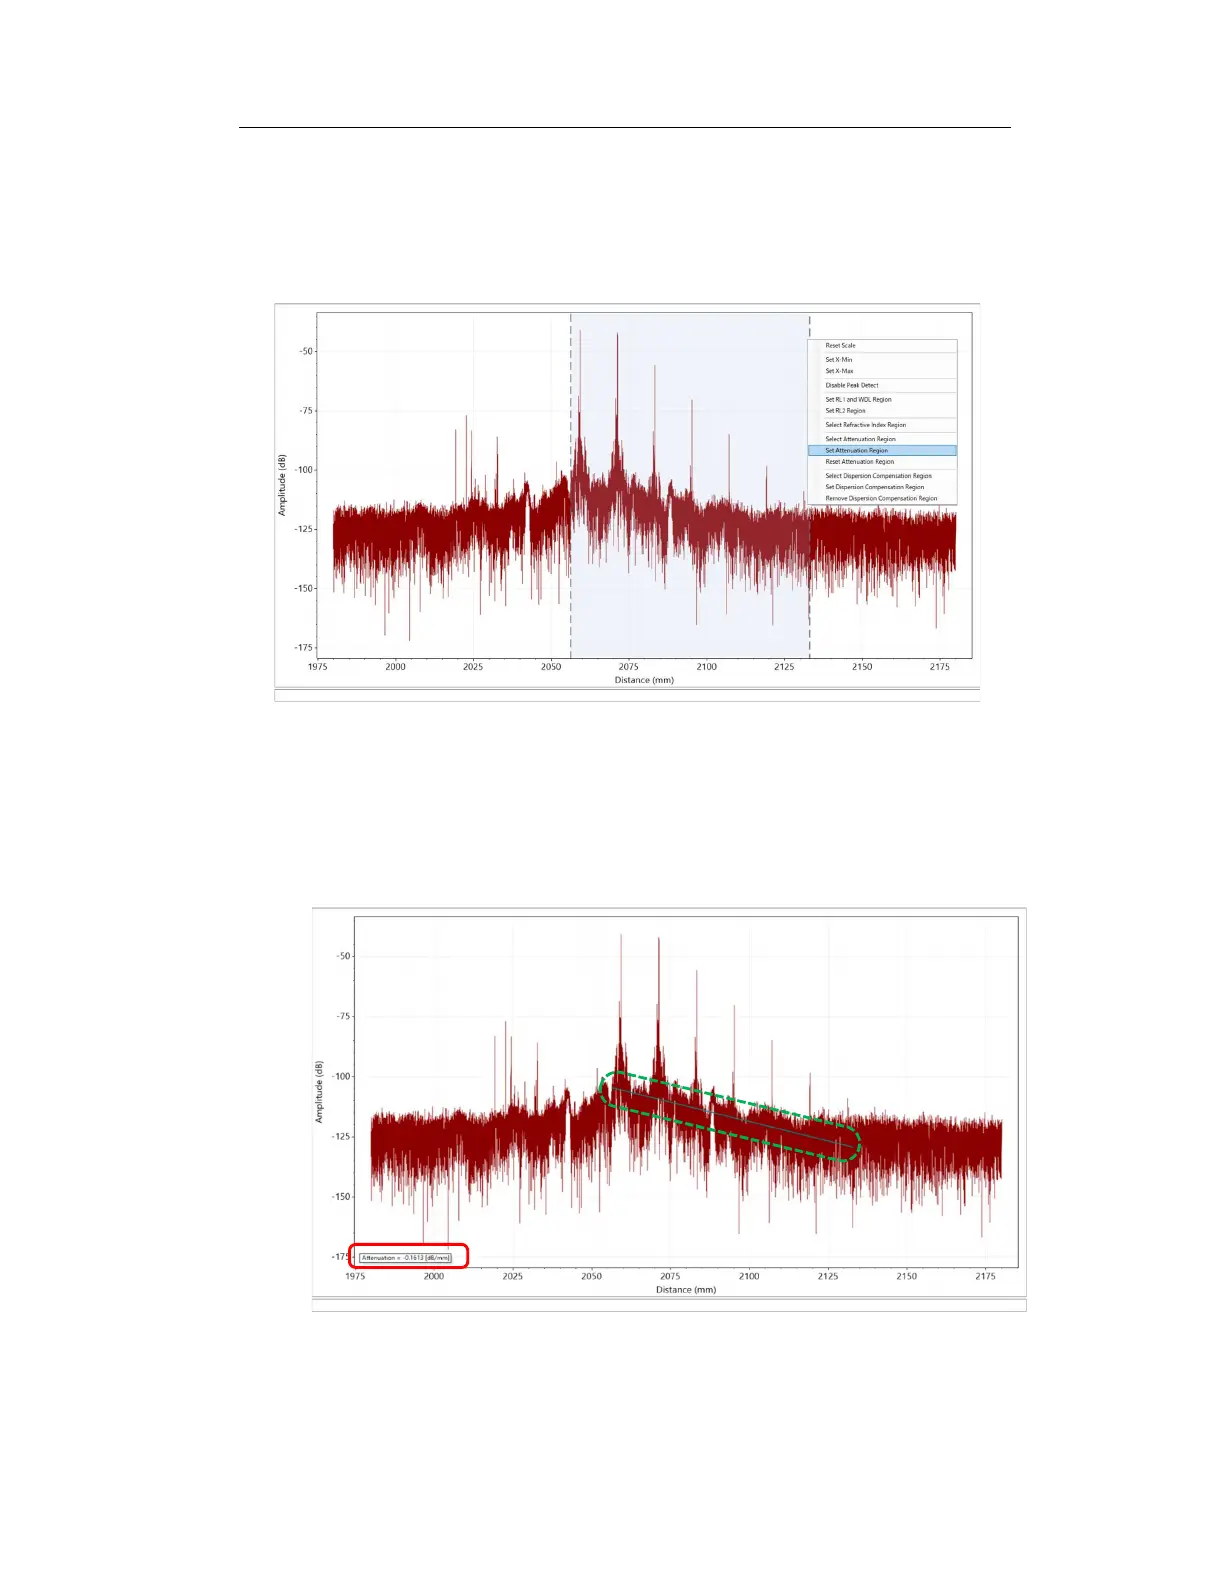
3. Drag the dotted lines to the left and right to adjust the dim blue area to the
area where you want to calculate attenuation. Right-click on the graph and
select "Set Attenuation Region".
Figure 6-39
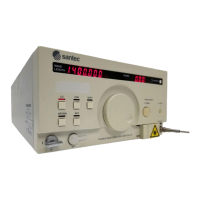
4. The attenuation is displayed in the specified units near the lower left of the
graph. In addition, the approximate straight line is displayed in green in the
area set on the graph.
Figure 6-40