,QWHU
YDO
5HIUHVKWLPHIRUVOLGLQJZLQGRZGHPDQG
&RQILJXUHG
DYHUDJLQJWLPH
6OLGLQJZLQGRZGHPDQGRYHU
DYHUDJLQJWLPH
W>V@
Figure2-1 Sliding window demand
The PAC4220 supplies sliding window demand values for a large number of measured
var
iables:
• Per phase or as a total value over all phases
• With the maximum and minimum values, and the time stamp of the extreme value
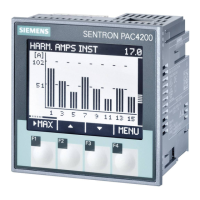
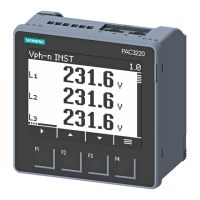
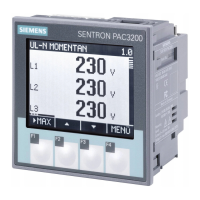
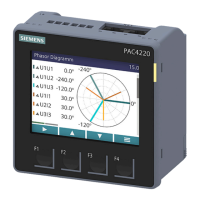
The sliding window demand values are represented on the display and can be called via the
communication interfaces.
The averaging time can be parameterized on the display or via the communication interface.
The following can be set: 3, 5, 10, 30, 60, 300, 600, 900seconds.
Representation on the display
The average character ∅ next to the measured variable (L1, L2, L3 or a, b, c) indicates that the
displayed value is a sliding window demand value.
2.3.3 Averaging measured values
Note
This function will be a
v
ailable at a later time via a rmware update.
Instantaneous values are averaged over dened time periods in or
der to generate measured
value proles. The average values can be read out and stored for this purpose. This reduces
the communication load and the storage requirements on downstream servers.
The PAC4220 has 3 average value generators that can be parameterized independently of
one another. The aggregation of the measured values reduces the bus load without risk of
losing information. Average values are calculated contiguously from all underlying values.
Description
2.3Measured variables
PAC4220
26 Equipment Manual, L1V30827278B-01
 Loading...
