6.2 Special displays
6.2.1 Phasor diag
ram
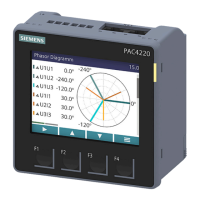
The phasor diagram provides a coherent picture of the actual unbalance values of the
fundamental.
The graphical representation is assigned a value table. F1
switches between the two
repr
esentations.
Special displays of the phasor diagram
① V
oltage U1
②
Current I1
③
Voltage U2
④
Current I2
⑤
Voltage U3
⑥
Current I3
⑦
Phase angle U1
⑧
Phase angle U1U2
⑨ Phase angle U1U3
⑩
Displacement angle U1|1
⑪ Displacement angle U2|2
⑫
Displacement angle U3|3
The length of graphical axes in the diagram symbolizes the amplitude unbalance.
Operation
6.2Special displays
PAC4220
Equipment Manual, L1V30827278B-01 71
 Loading...