101
Using Solar-Log WEB
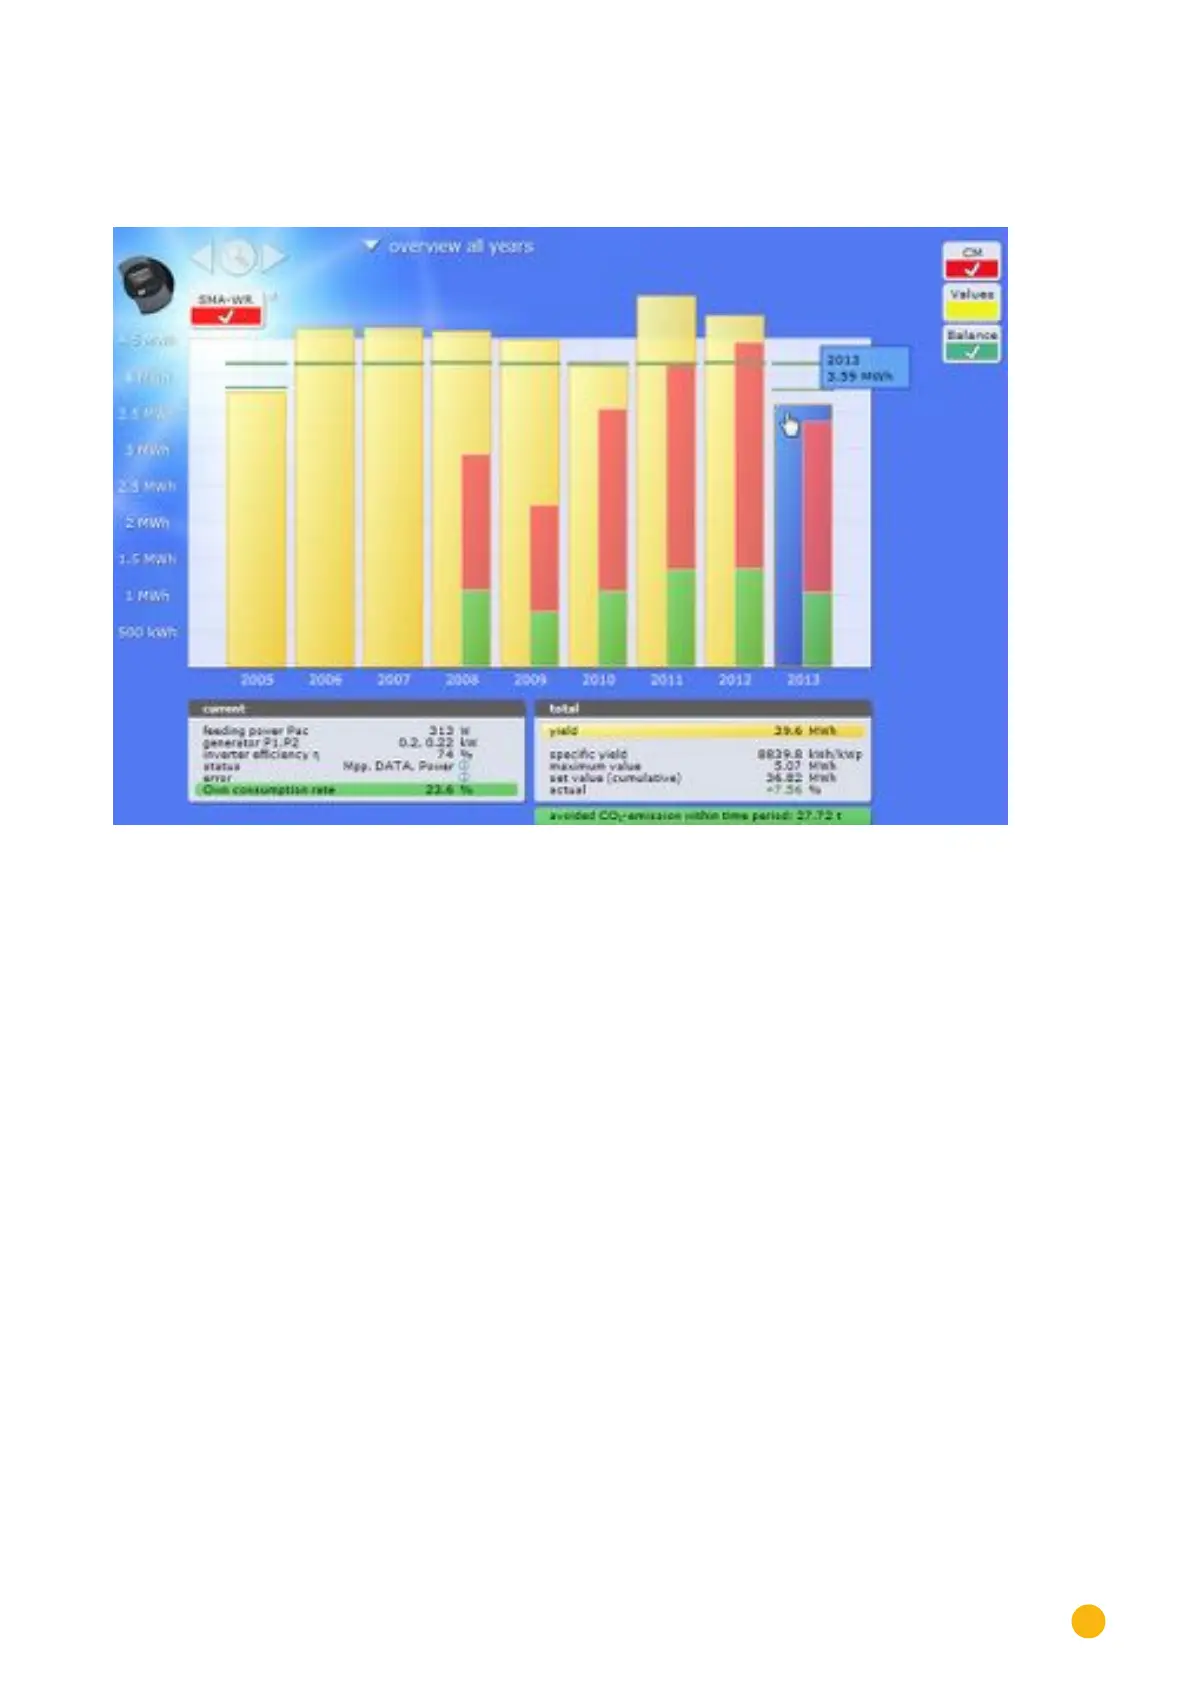
7.3.6 Total Overview
Select Overview of all Years from the navigation menu.
Fig.: Plant C2 - Total Overview
The individual annual yields are displayed as a total in a bar graph. The dark green line indicates the annual
target yield. Two green lines are then displayed for the current year:
•
The top line indicates the annual target.
•
The bottom line indicates the accumulated annual yield compared to the annual target.
Move the mouse above one of the year bars.
• The yield from the selected year is displayed.
By clicking on a bar,
•
the corresponding annual overview is displayed.
Click on Linear Overview Years:
•
The total linear overview is then displayed.