20
Operating via a web browser within your own network
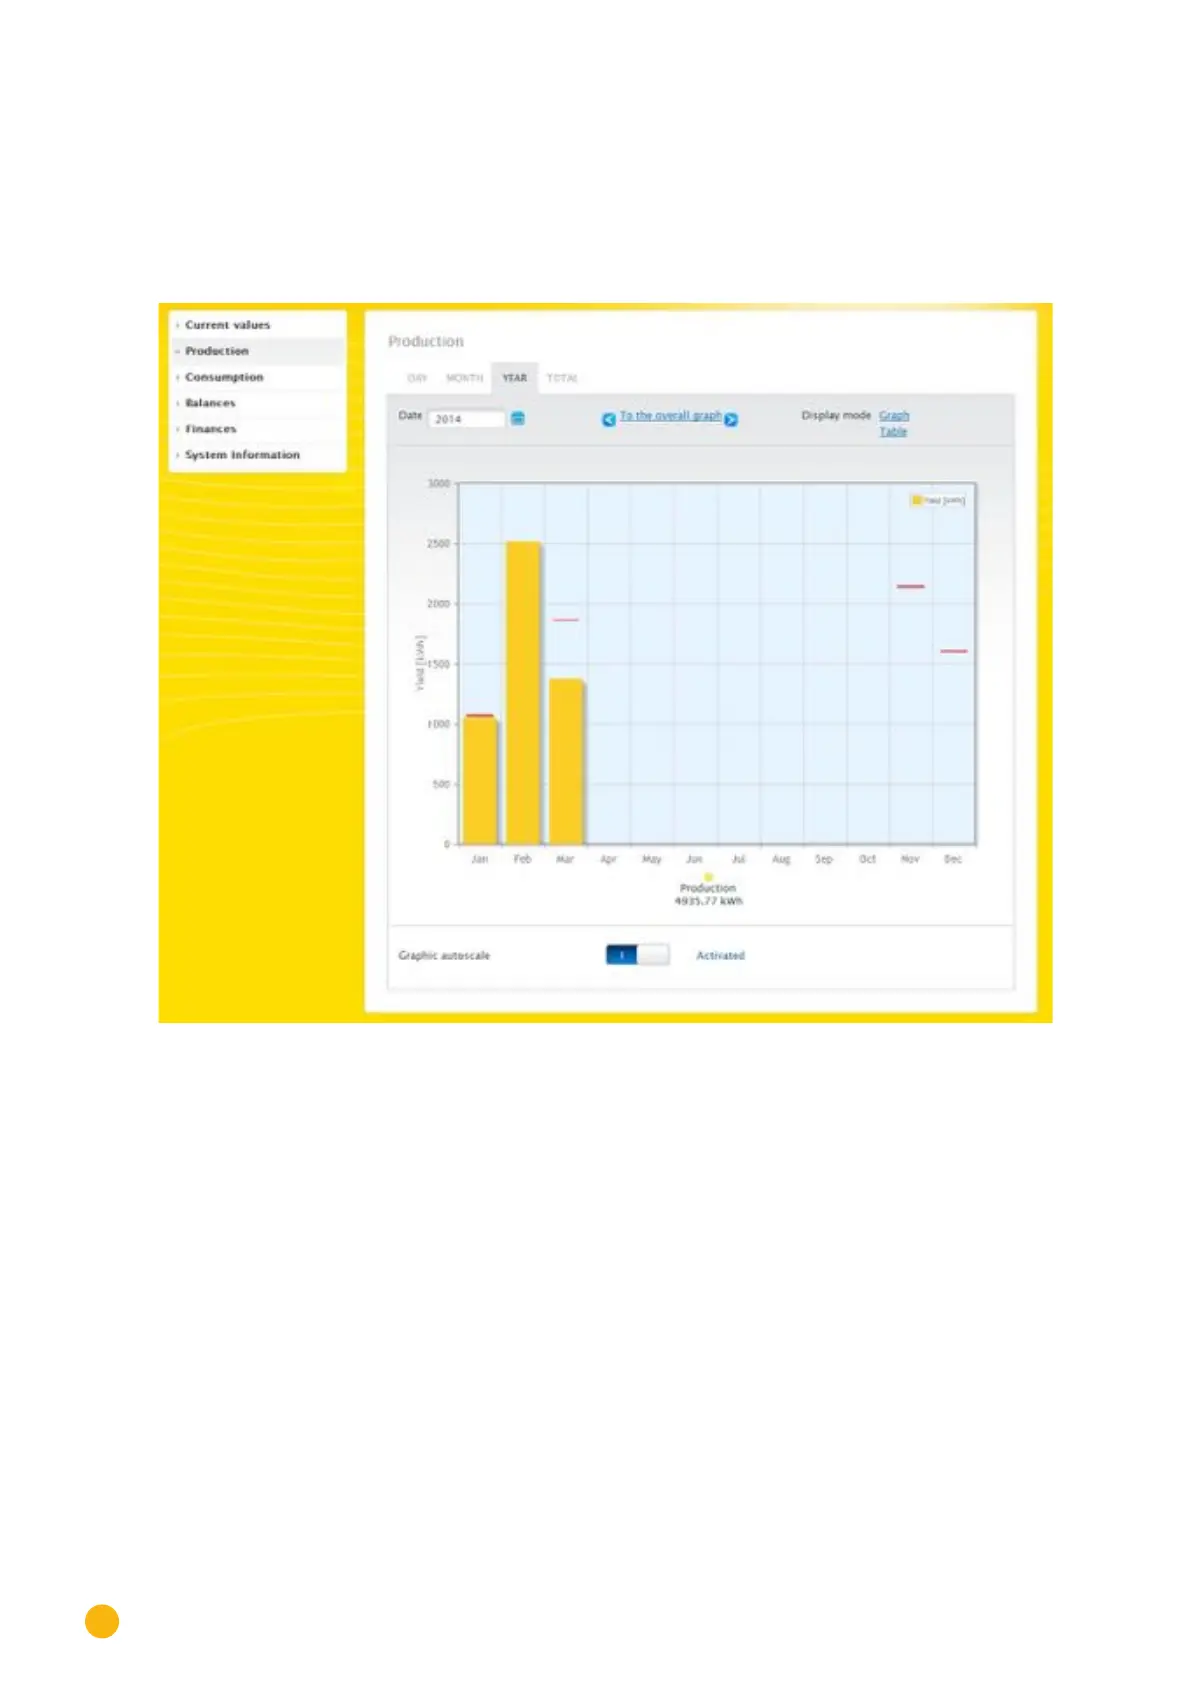
2.5.3 Year view
The Year tab displays the monthly yields from the year as a total in a bar graph.
•
Move the mouse above one of the bars to display the monthly yield with a comparison of the cur-
rent and target values in regard to the annual forecast.
•
Click on a bar to go to the corresponding month view.
Fig.: Year view graph
When you click on Table, the annual values for the entire year are allocated to each month according to
the actual output generated.