37
Operating via a web browser within your own network
Module field comparison
To access the Module field comparison menu, go to Diagnostic | Inverter Diagnostic | Module field com-
parison.
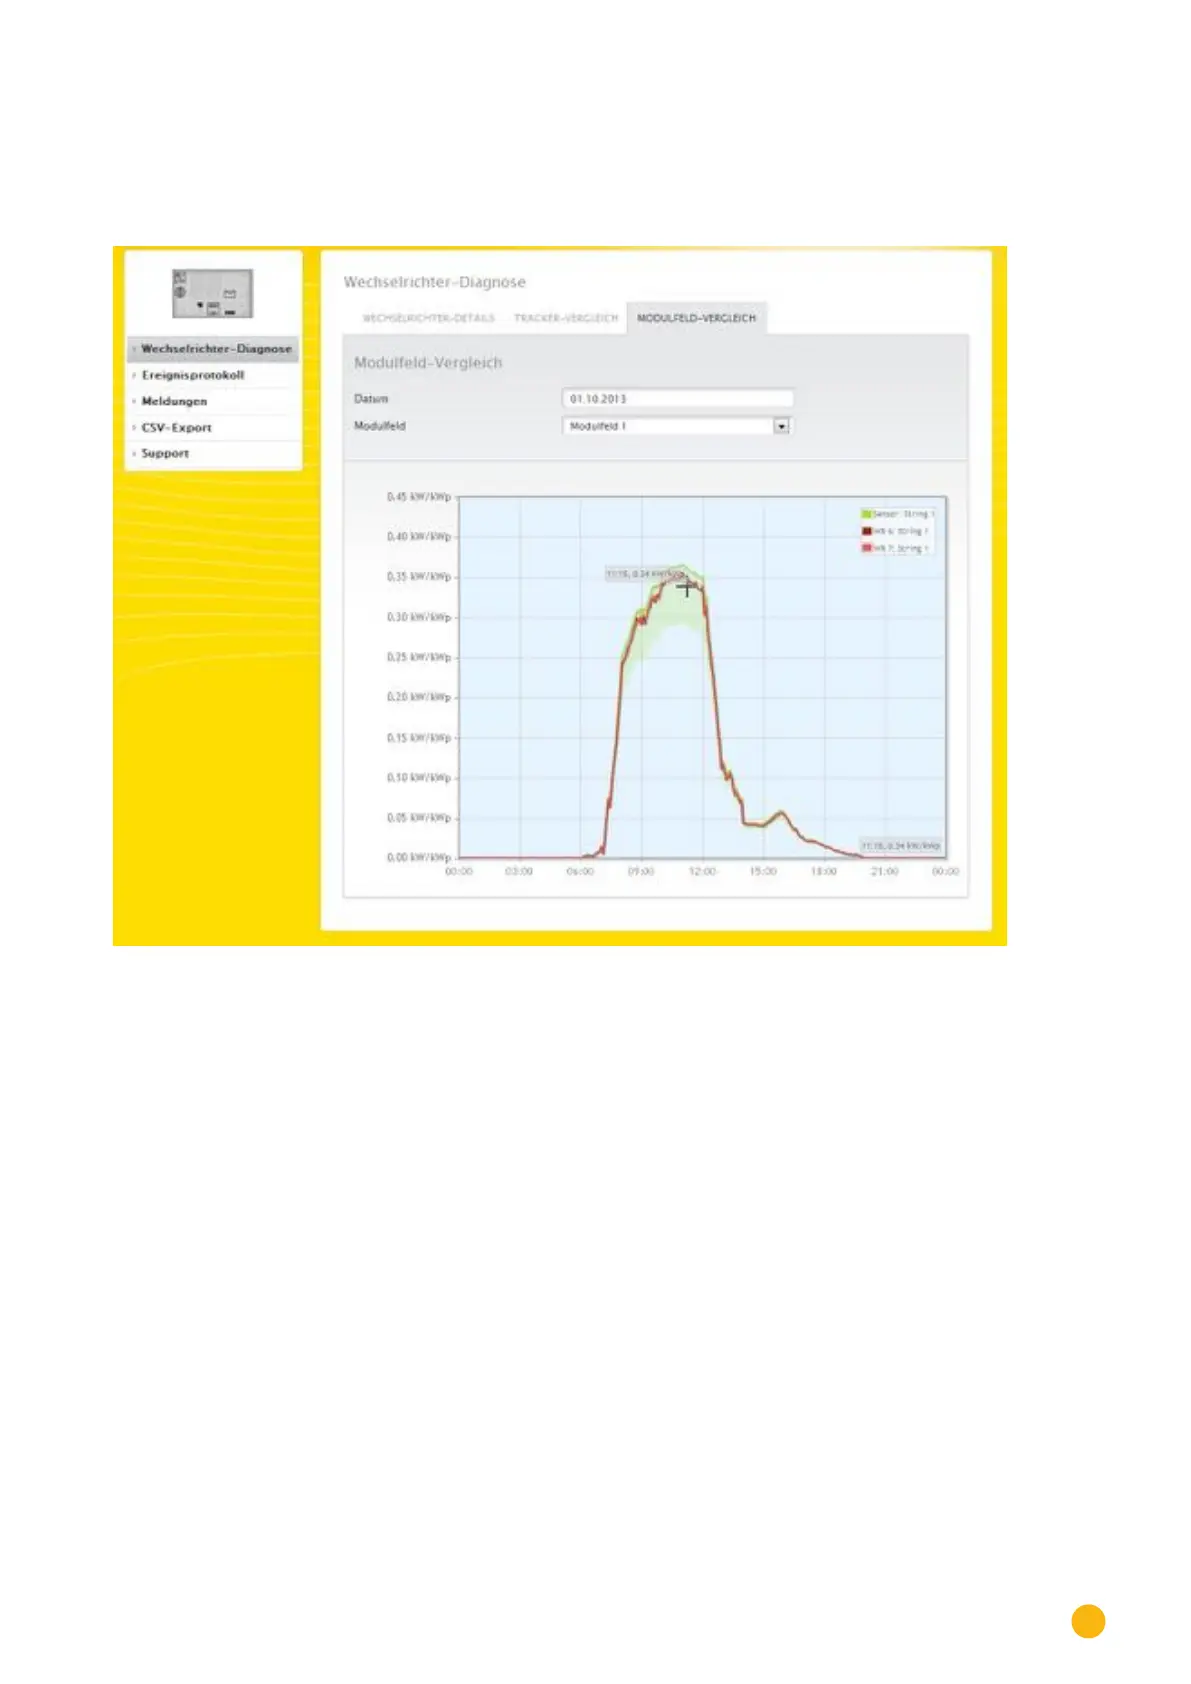
Fig.: Module eld comparison graph
With the Date and Module Field boxes, the module field comparison permits all devices (e.g. inverters and
sensors) and their strings that are assigned to the same module field to be compared on the current and
previous days (see Fig.: Module field comparison graph) in order to more efficiently detect faults from the
performance monitoring.
In the example graph, the following values are displayed:
• Sensor
• Inverter 6
• Inverter 7
The gray areas along the course of the sensor line show the range of tolerance in which the plant should
operate.
All of the displayed values can be directly selected and deselected at any time by clicking in the graph key
(upper-right corner of the graph).