21
Operating via a web browser within your own network
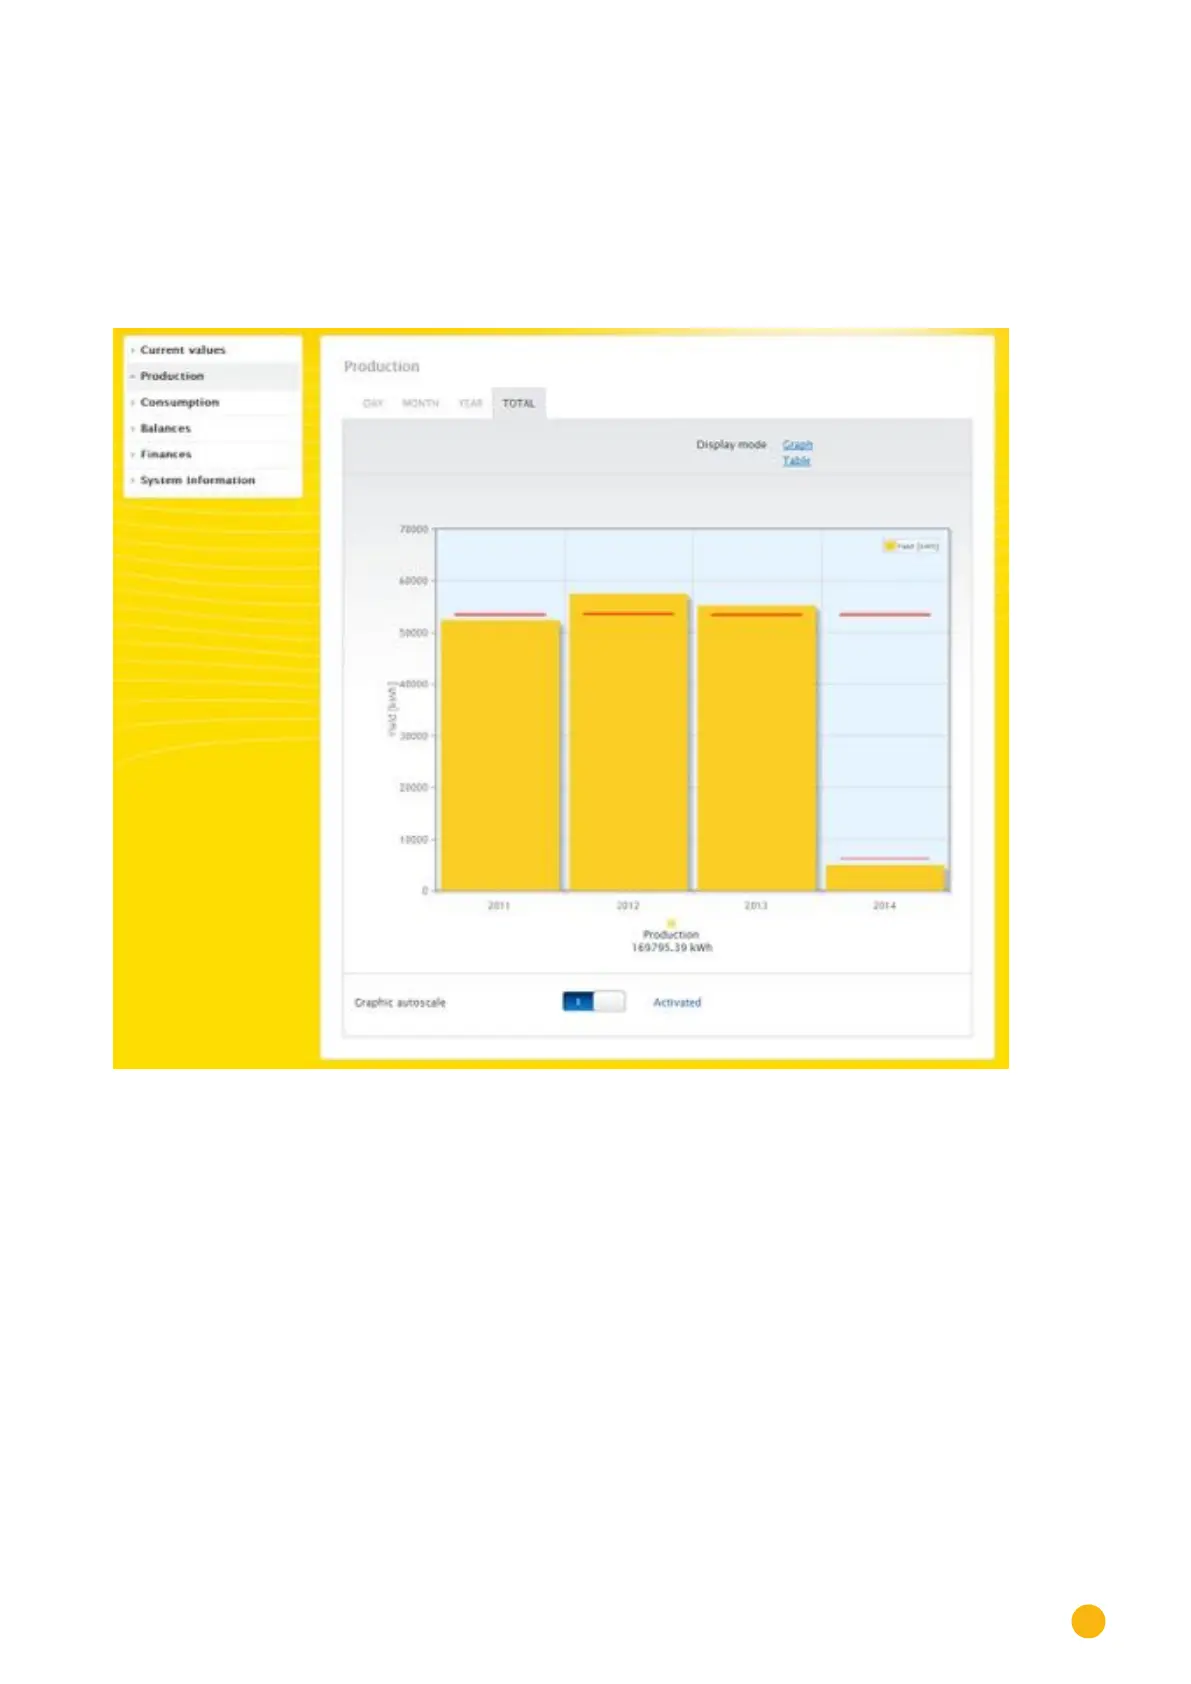
2.5.4 Total view
The Total tab displays the annual yields as a total in a bar graph. The red line displays the target balance
that is calculated according to the annual forecast.
•
Move the mouse above one of the bars to display the annual yield with a comparison of the current
and target values in regard to the annual forecast.
•
Click on a bar to go to the corresponding year view.
Fig.: Total view graph
Table:
The plant's total power output (since the monitoring started) is allocated every year according to the out-
put generated.
The
Date box is included in the day, month and year view and has a calendar function with which you
can search for certain days, months or years according to the view selected. You can go backwards and
forwards within the selected period with the arrow keys for the previous day or week, or for the following
day or week.