111
Using the Solar-Log™ Android App
The daily yields of the selected month are displayed as a bar graph.
3. Swipe to the left to go to the next view or to the right to go back to the previous view.
4. Swipe up or down to change the module views.
8.5.3 Annual Overview
1. Tap on the symbol in the toolbar at the top right corner of the screen.
The navigation screen then appears.
2. Select Year to go to the annual overview.
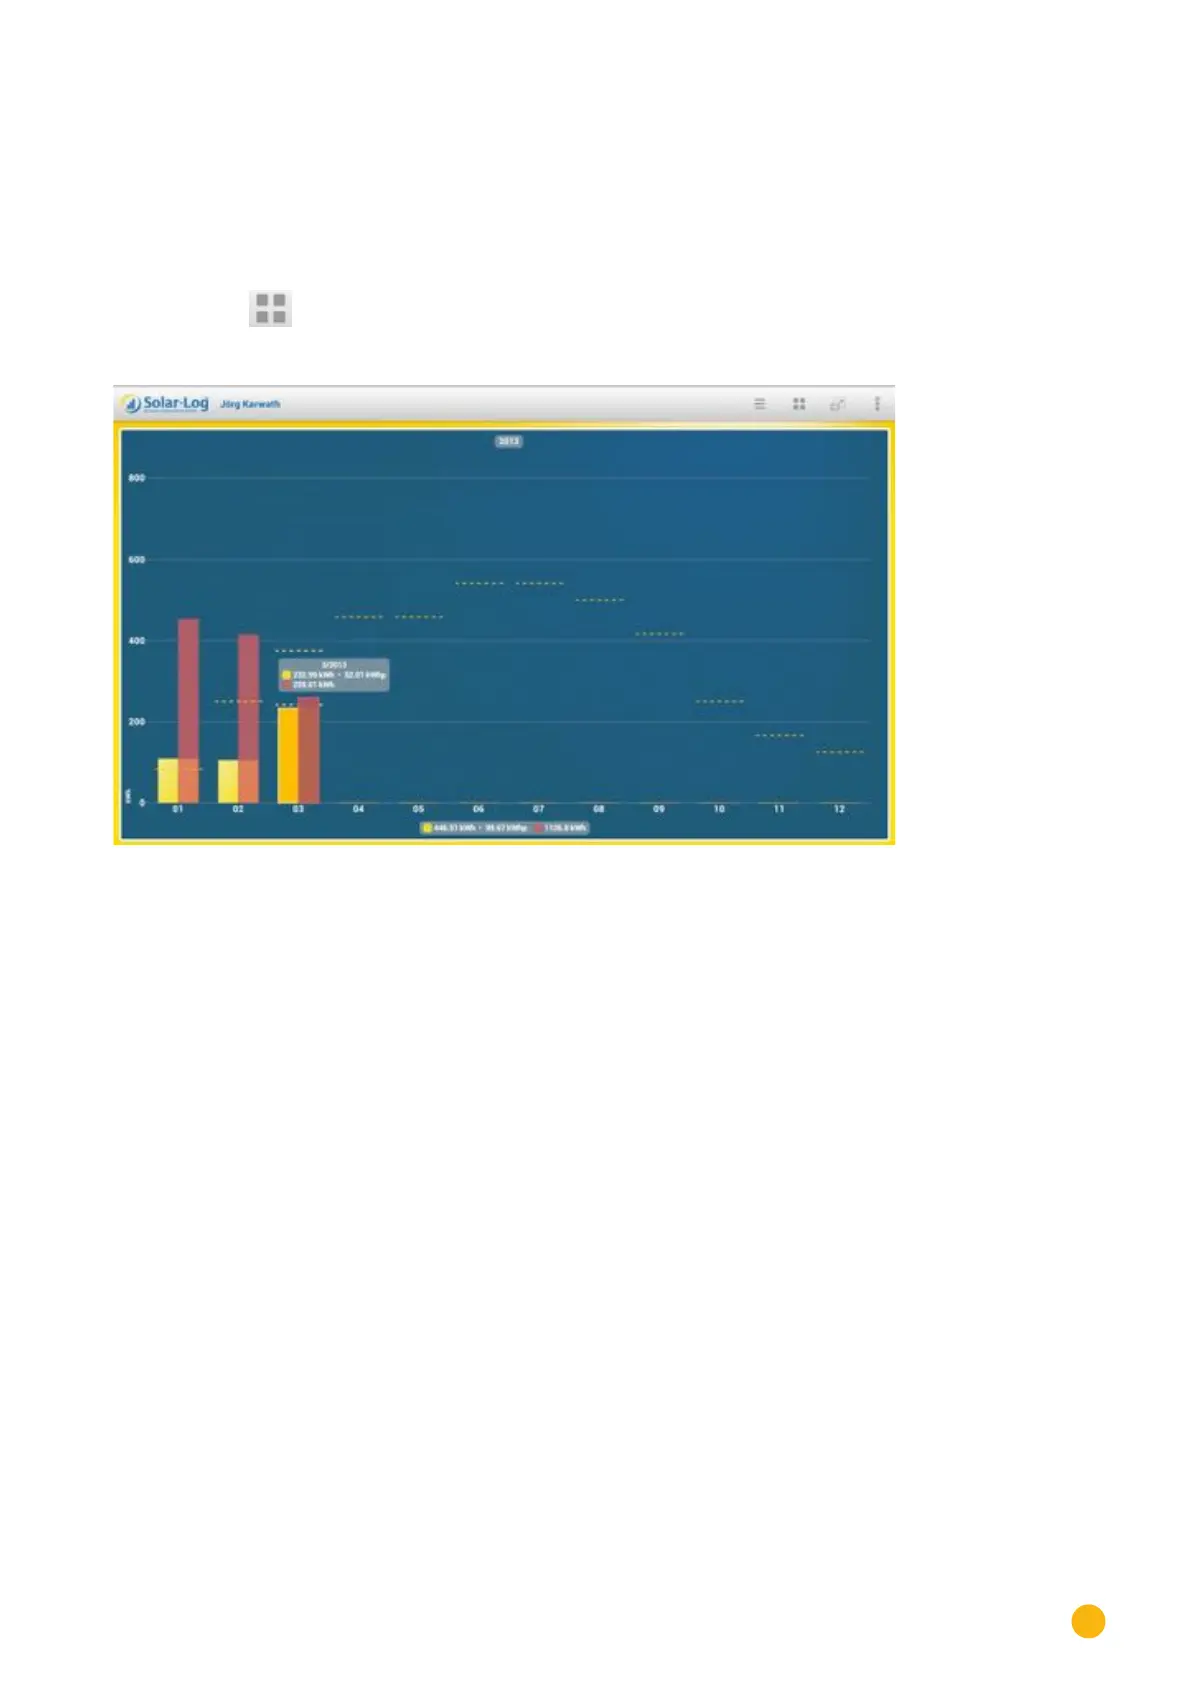
Fig.: Annual Overview as a bar graph
The monthly yields of the selected year are displayed as a bar graph.
3. Swipe to the left to go to the next view or to the right to go back to the previous view.
4. Swipe up or down to change the module views.