97
Using Solar-Log WEB
7.3 Accessing Yield data
7.3.1 How to navigate between dierent overviews
How you navigate the website overviews corresponds to navigating the overview page from your local
network.
Switching between overviews
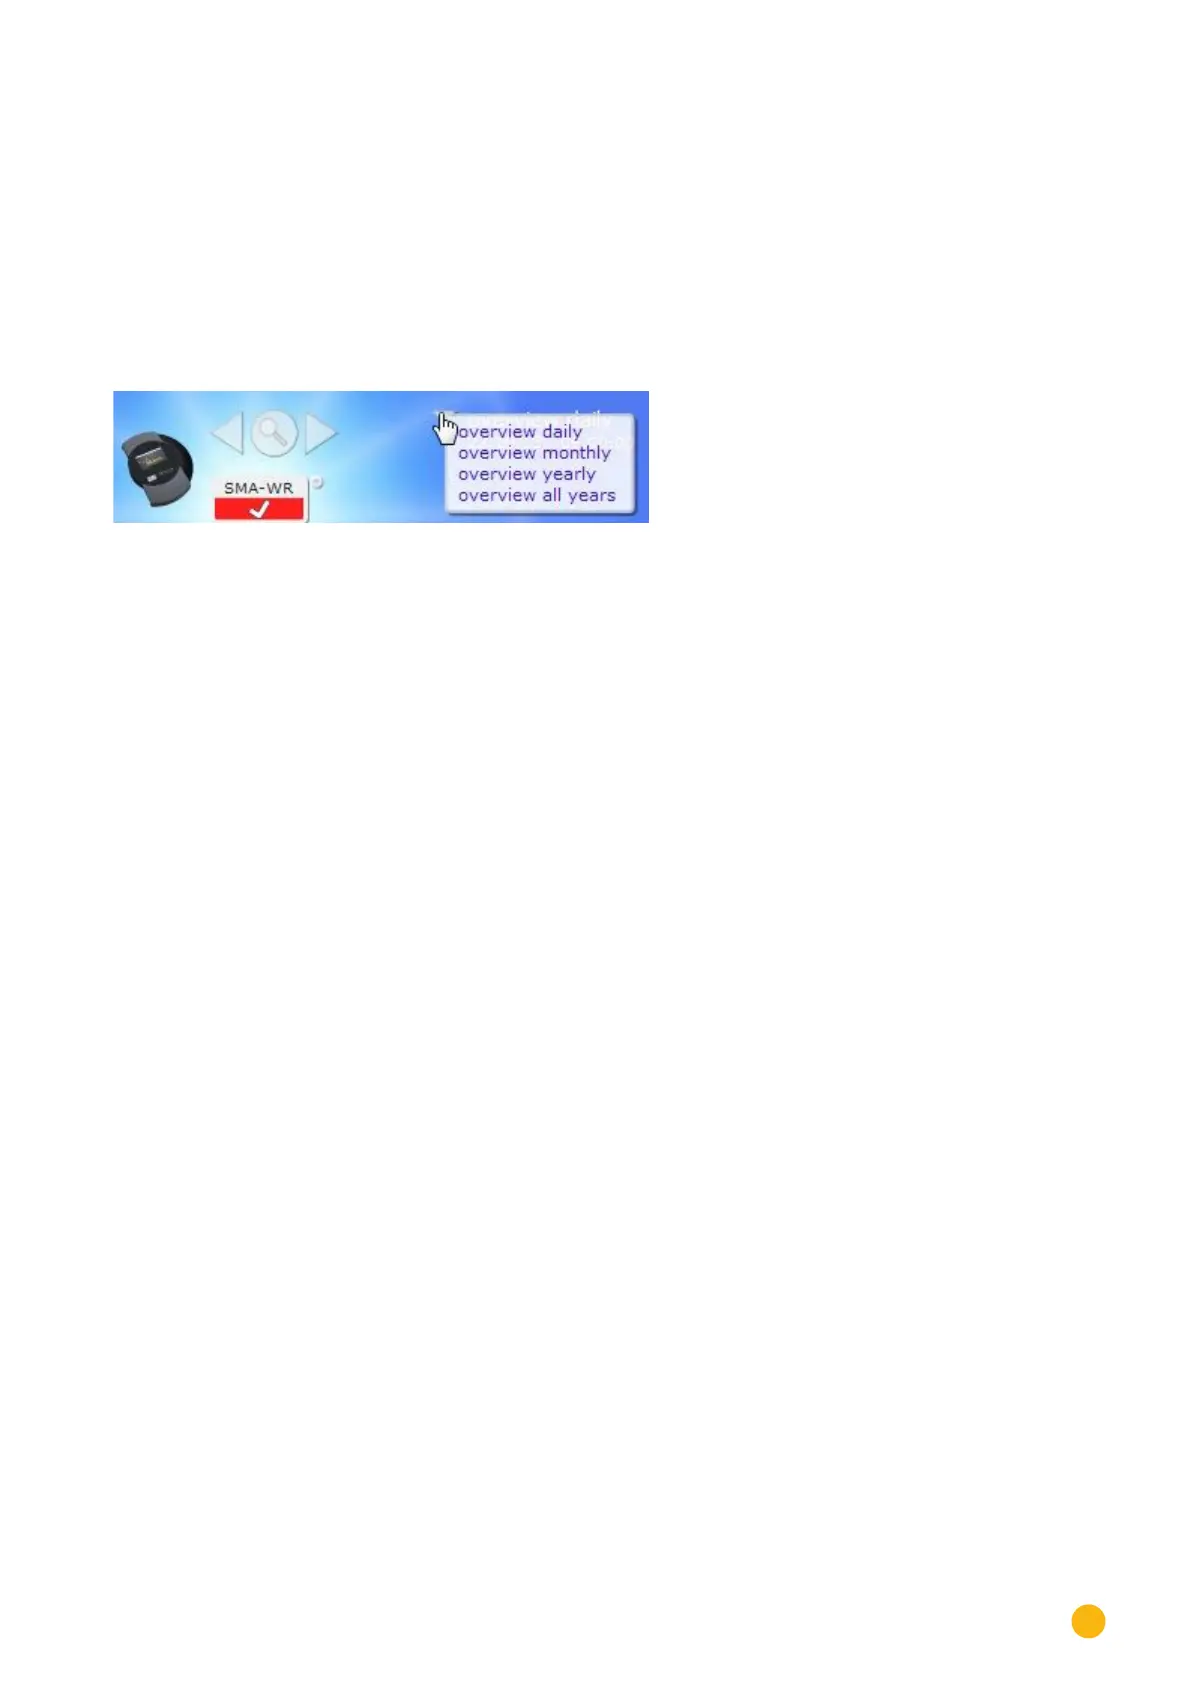
Move your mouse to the inverted triangle on the left next to the displayed period.
An overview of the periods is displayed.
Fig.: C2 Navigating in the view
Click on the desired period.
The period overview is then displayed.
7.3.2 The meaning of the values in the overviews
The values displayed below the graph correspond to the values from the overview page from your local
network.
Due to privacy concerns, the plant revenues are not displayed on the Internet site.