Levelogger Series User Guide
Page 49
The Title and Axis Option is used to enter the title of the graph and change the Y axis label or user selected
scale. Check the Best Fit box to enable the software to determine the best fit scale. If the Best Fit box is not
checked, the user has to enter a maximum and minimum value of the selected channel. The X axis is logging
time.
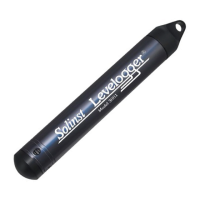
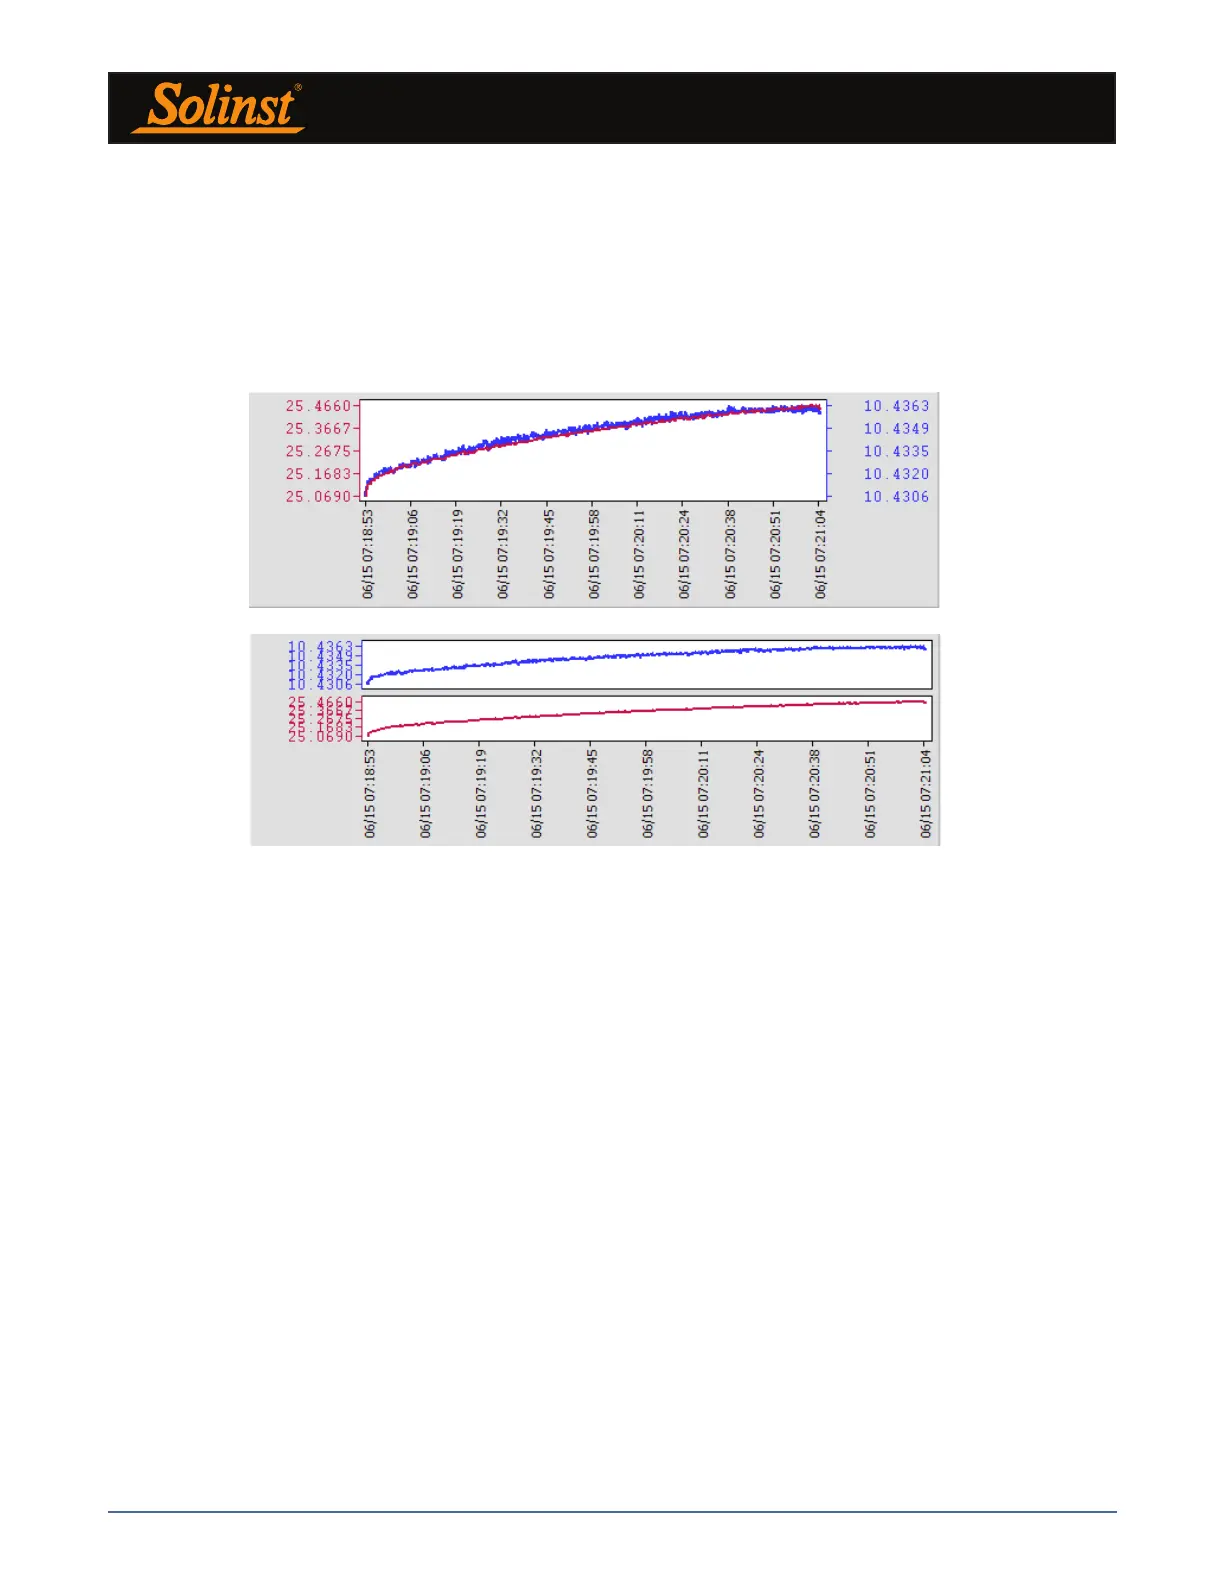
There is the option to show Combined Plot graphs or Separated Plot graphs of the data. Choosing a
Combined Plot will show the data from each of the channels in one graph. The Separated Plot option will
show a separate graph for each data channel.
Figure 7-8 Combined and Separated Plot Graphs