Levelogger Series User Guide
Page 48
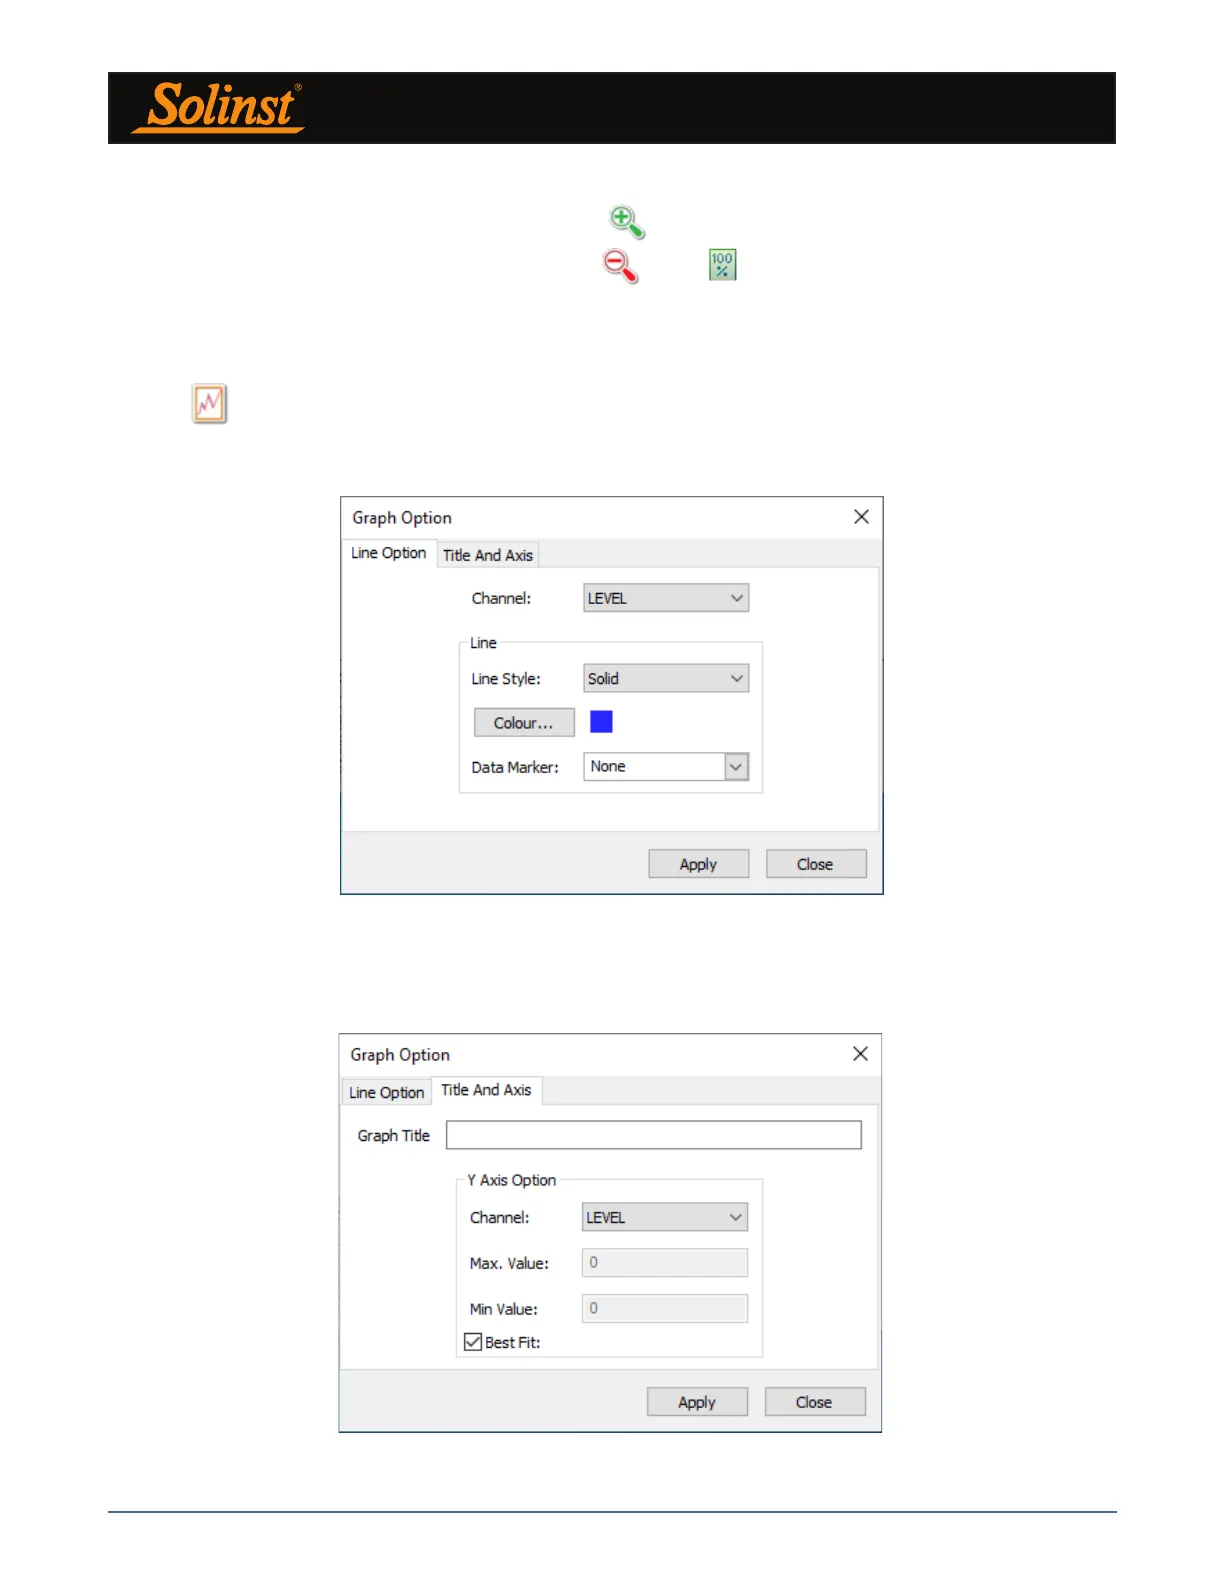
Figure 7-6 Line Option Window
7.2 Graph Manipulation and Zoom Function
To perform the Zoom In function on the graph, click .
To perform a Zoom Out function on the graph click . Click to undo all the zoom functions.
The Zoom functions can also be used for data selections in the graph.
Note: Right click, and drag the mouse to scan the data graph.
Click to open the Graph Option Dialog. The Graph Dialog is shown in Figure 7-6.
Note: As there is only one channel of data for Rainloggers, there are no graphing options.
The Line Option is used to adjust the style and colour of the line in the graph for each channel. The user can
also select the shape of the data marker or remove the data marker.
Figure 7-7 Title and Axis Option Window