7 Interpreting Measured I-V Curves
7-5
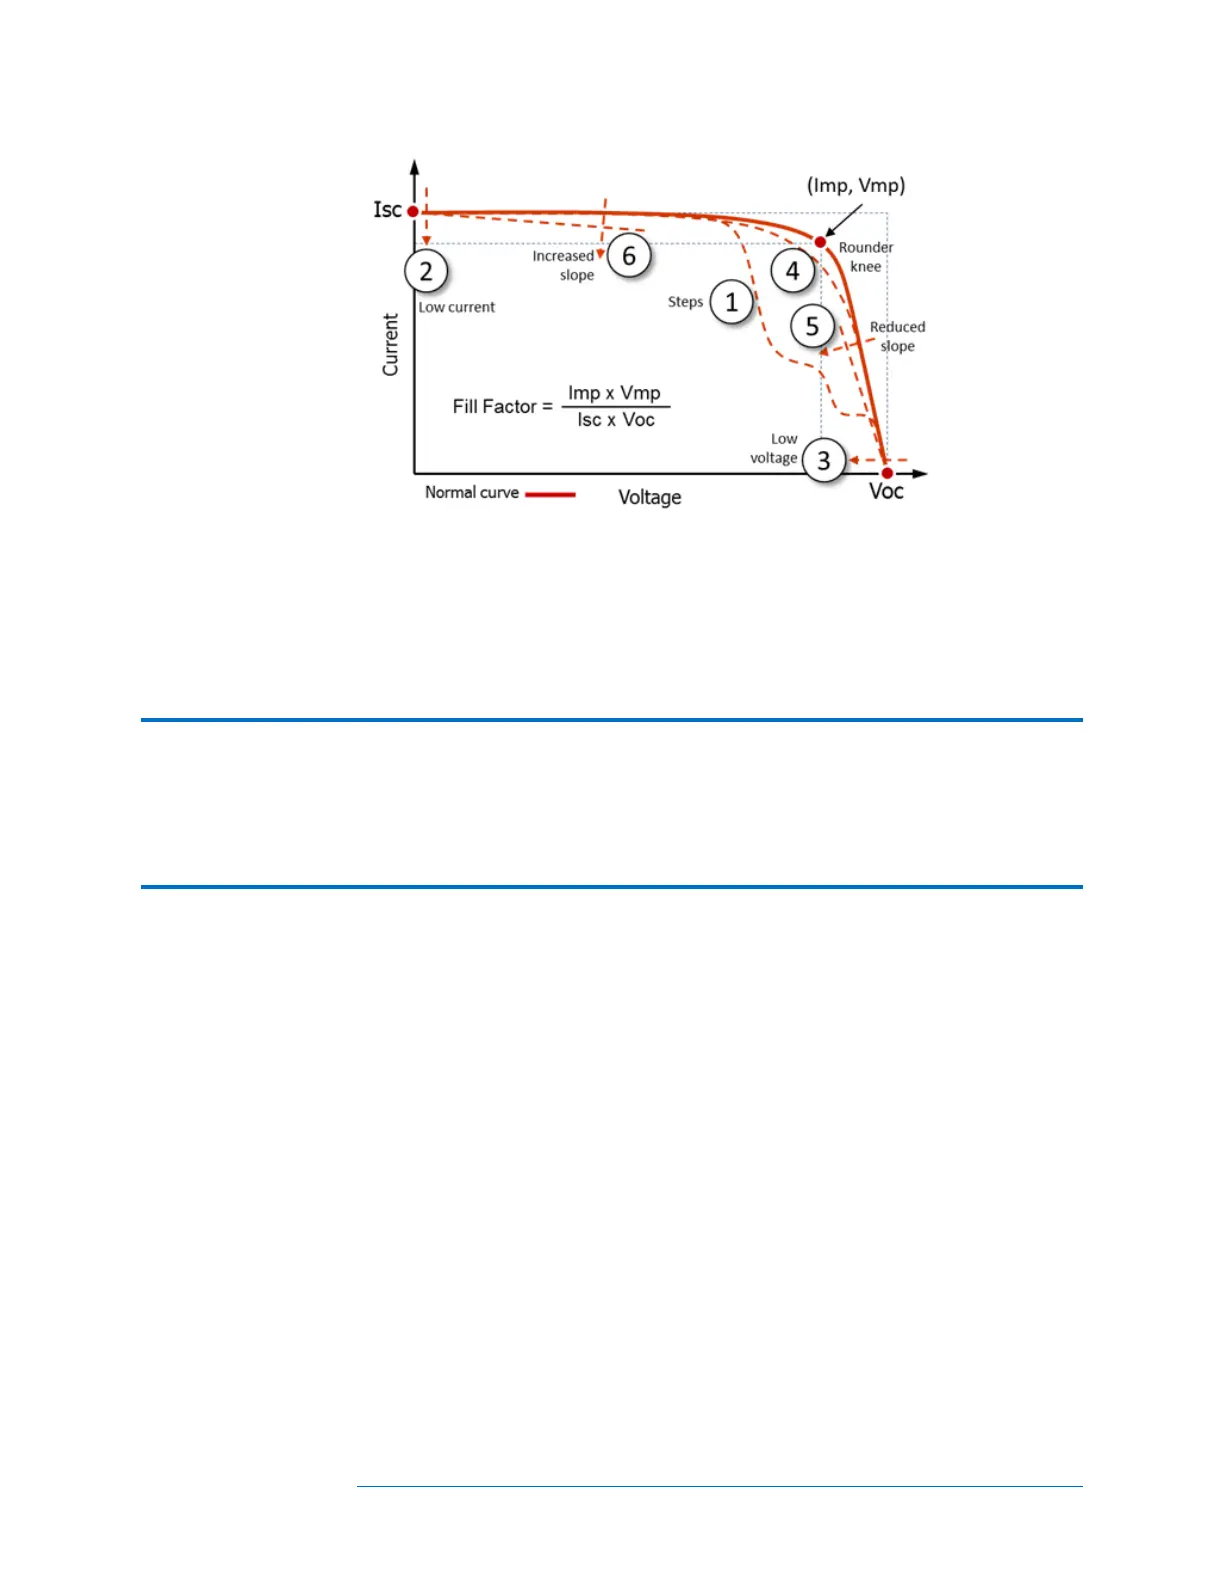
Figure 59. Deviations in the shape of the I-V curve fall into one (or a combination)
of these six categories
It would be convenient if each of the I-V curve deviations illustrated in Figure 59
corresponded to a unique physical cause. In fact, there are multiple possible causes for
each.
NOTE Deviations from the predicted IV curve may be due to physical problems with the PV
array under test or may be the result of incorrect model values, instrument settings, or
measurement connections. Always select the correct PV module from the on-board PV
module list, double check the measurement connection, and ensure that irradiance
measurements are taken in the plane of the array and are as simultaneous with the I-V
sweep as possible.
Small deviations between the measured and predicted I-V curves are very common given
the uncertainty associated with the irradiance and temperature measurements and the fact
that PV modules, even of a given manufacturer and model number, are not all identical.
Shading and soiling will also have effects, which are not included in the PV model.
Potential causes of substantial deviations between measured and predicted I-V curves are
discussed below.
 Loading...