7 Interpreting Measured I-V Curves
7-7
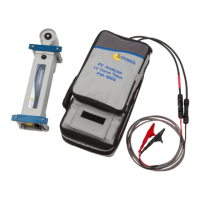
Figure 61. The shading impact of placing a business card on a single cell in a string
of fifteen 180-watt modules
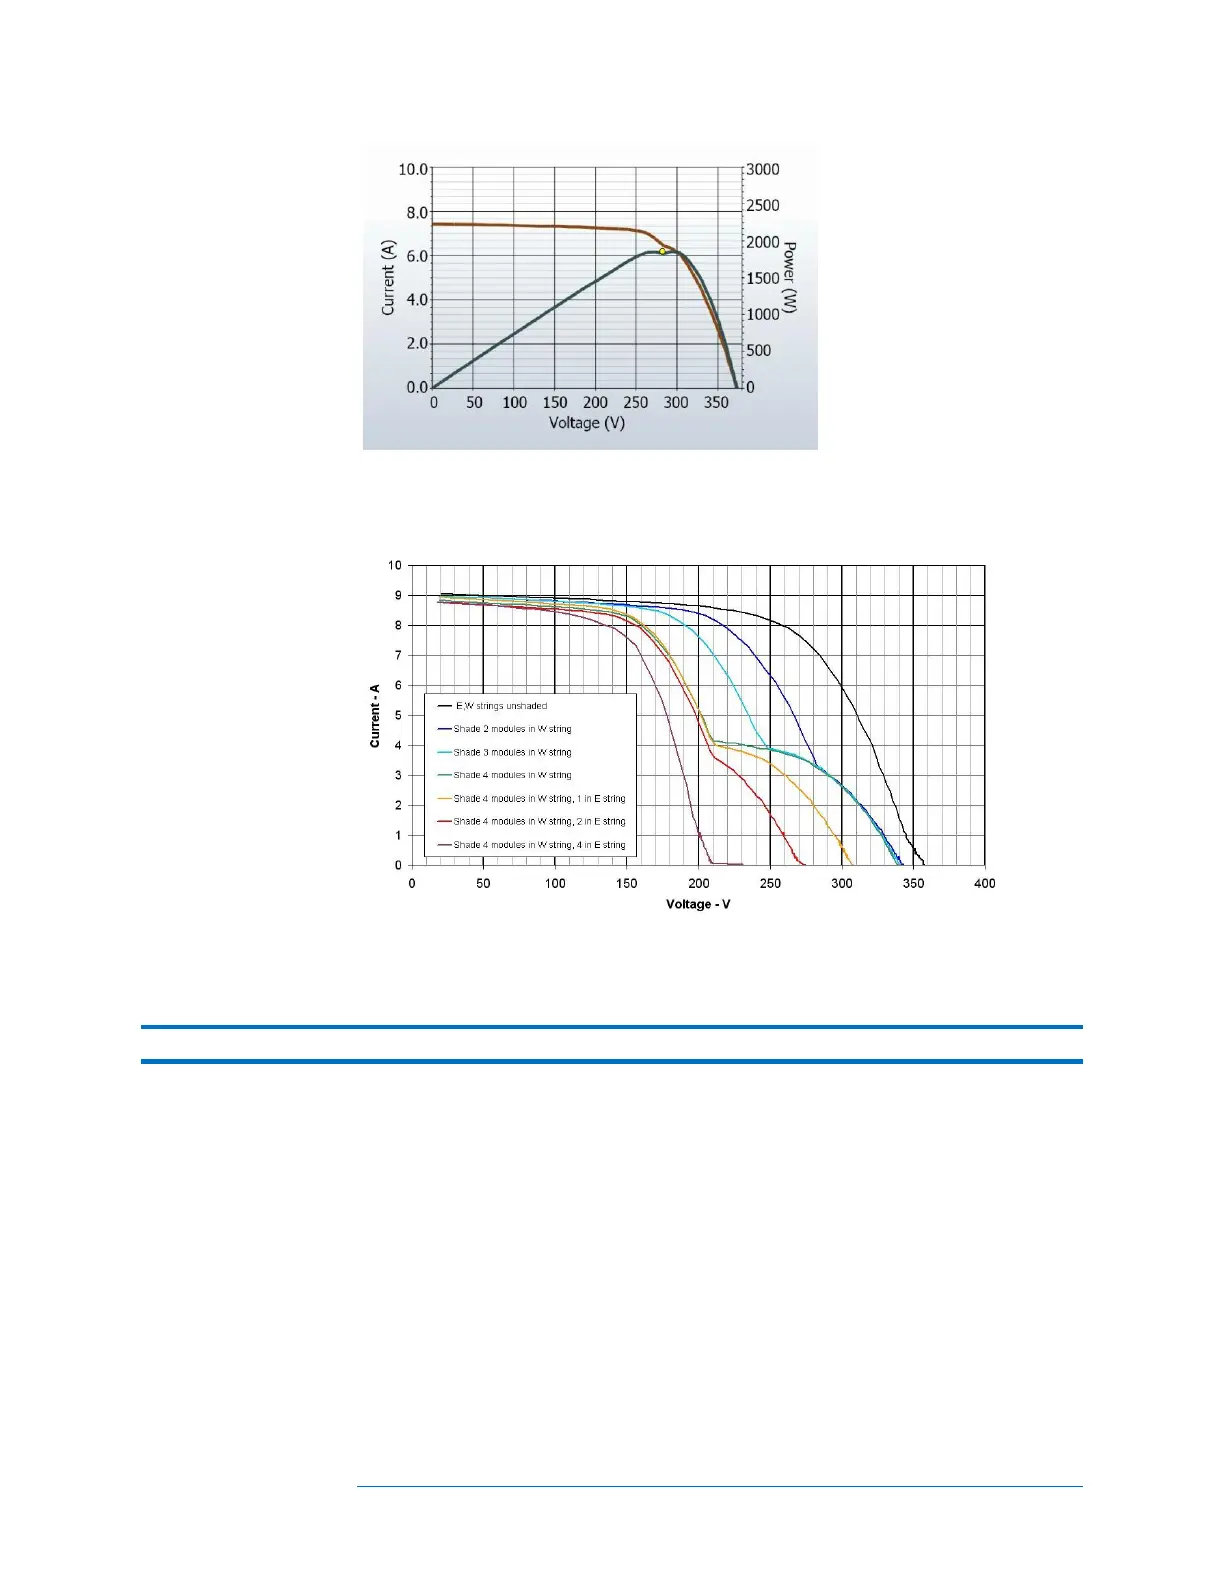
Figure 62. The effect of intentionally shading entire modules in different
combinations, in two parallel-connected strings
NOTE The graphic shown in Figure 62 is an overlay of several I-V curve measurements.
In general, these types of patterns in the I-V curve are indications of mismatch between
different areas of the array or module under test. Although the figures shown above all
involve shading, mismatch can have other causes. The notches in the I-V curve are
indications that bypass diodes are activating and passing current around module sub-
strings (internal cell strings) that are not able to pass the full current of the stronger
modules.
Potential causes are summarized below, and then discussed in more detail.
Potential causes located in the array include:
• Array is partially shaded, or non-uniform soiling or debris is present
• PV cells are damaged
• Bypass diode is short-circuited
 Loading...