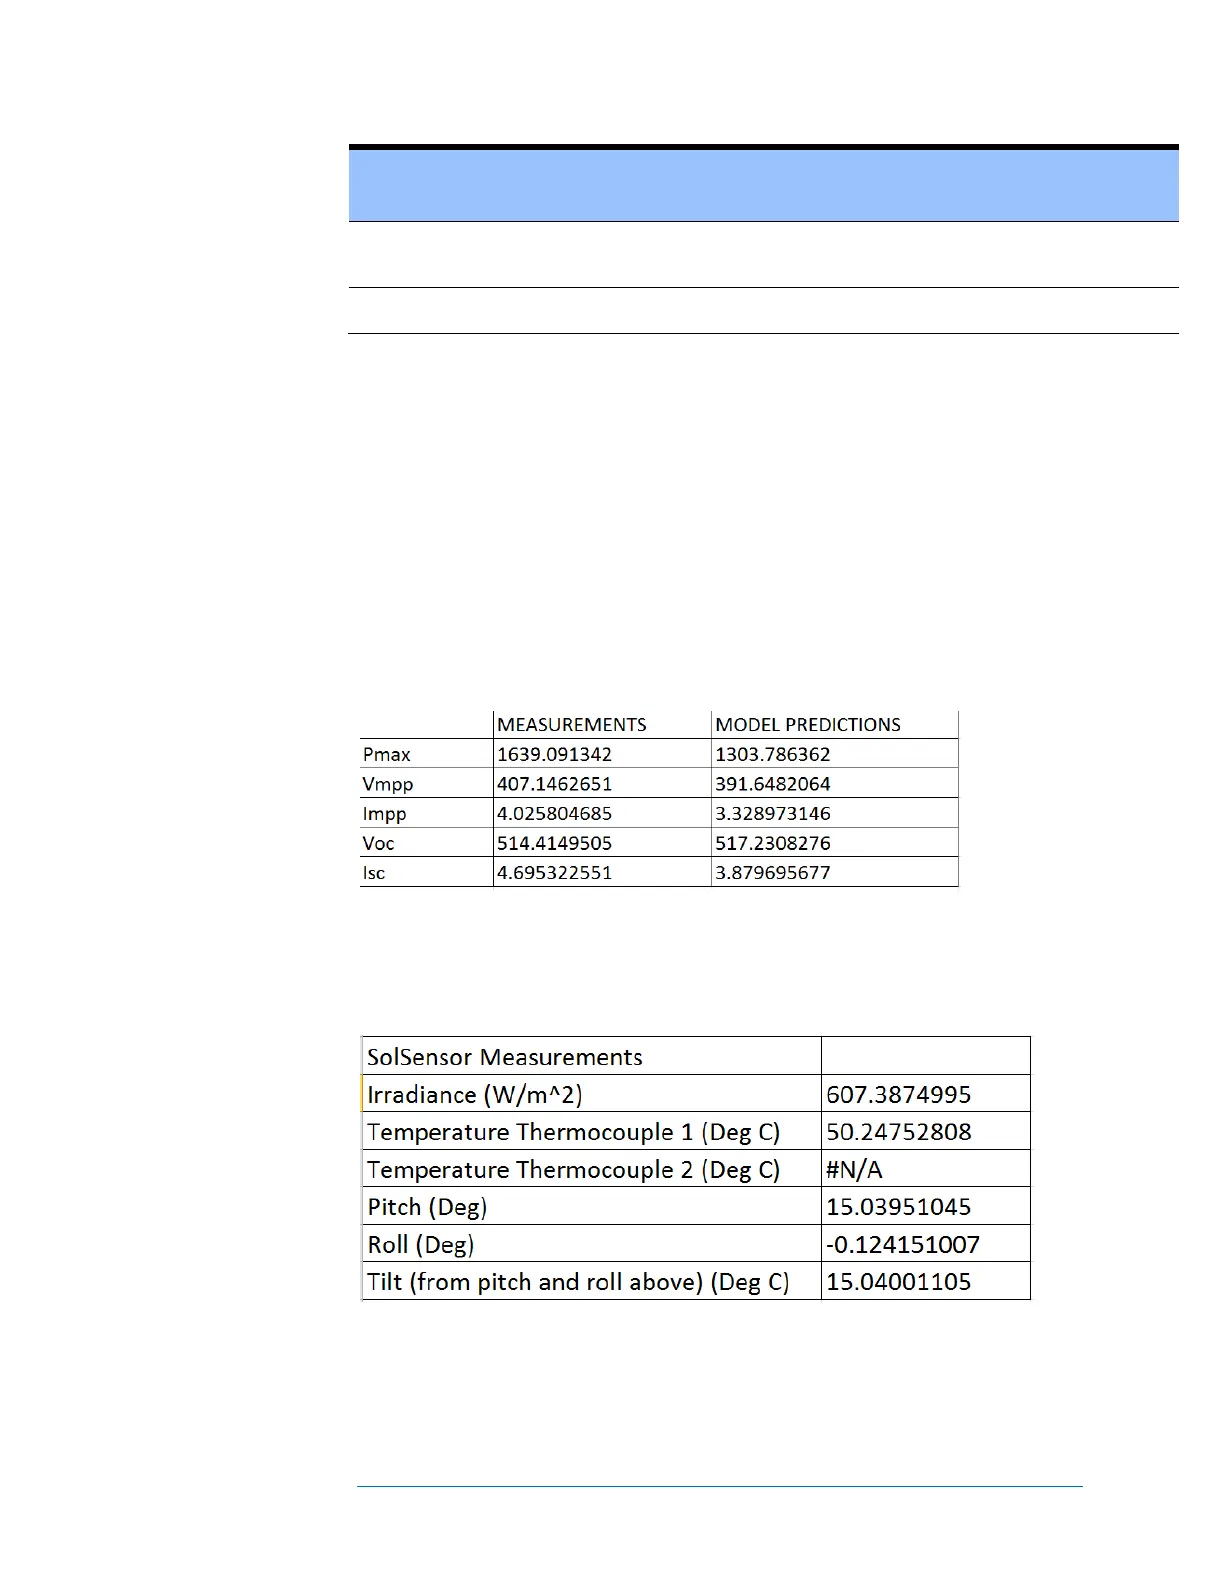
Figure 51 shows the cardinal values of the measured and predicted I-V curves. The
abbreviations represent maximum power, maximum power voltage and current, open
circuit voltage, and short circuit current.
In the PVA's PC software, the value of Pmax is obtained by fitting a third-order
polynomial curve to the P-V (Power vs Voltage) curve, and then calculating Vmp (max
power voltage) from the peak of the fitted curve. This value of Vmp is then used to
interpolate Imp (max power current) from the I-V curve. This method reduces the amount
of uncertainty contributed by electrical noise in the current and voltage measurements.
The Data Analysis Tool (DAT) re-calculates Pmax for its purposes of charting and
reporting data. It optionally fits a fourth-order polynomial, which can result in a very
slight difference in Vmp, Imp, and Pmax between the PVA PC software and the DAT.
Figure 51. The Measurement vs. Model section of the exported csv file
Figure 52 shows the SolSensor Measurements section of the exported csv file, and the
table that follows describes the contents. All of the values were recorded at the time the I-
V measurement was made.
Figure 52. The SolSensor Measurements section of the exported csv file
 Loading...