26
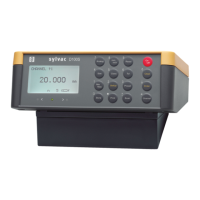
Following display :
-3s = - 3
σ = lower regulation or intervention limit.
+3s = + 3
σ = upper regulation or intervention limit.
-NG = number of stored values smaller than lower tolerance.
+NG = number of stored values greater than upper tolerance.
%Def = percentage of defective stored values =
Cp = process capability =
Cm = machine = capability s given for a sample at time t.
A high Cp will indicate a small dispersion of measured values inside the tolerances :
High Cp : mauvais Cp : Low Cp :
Cmk = center capability= the smaller value of the 2 formulas or
Cpk = process capability in relation to spec or
mean = the small value of
Cmk/Cpk will formulate capability in a manner that indicates shifts (skewing) in the mean of distribution away from
the midpoint :
Good Cmk/Cpk Poor Cmk/Cpk :
Cp >= 1.33 corresponds to a capable process.
Note: some users require a Cp > = 1.66 which corresponds to 10σ.
These indices of capability are certainly an efficient way of taking decisions but their importance must not be
exaggerated. Without process analysis, i.e. without knowing the dispersion, random factors and system influences,
the indices are only of limited value and may lead to erroneous decisions being taken.