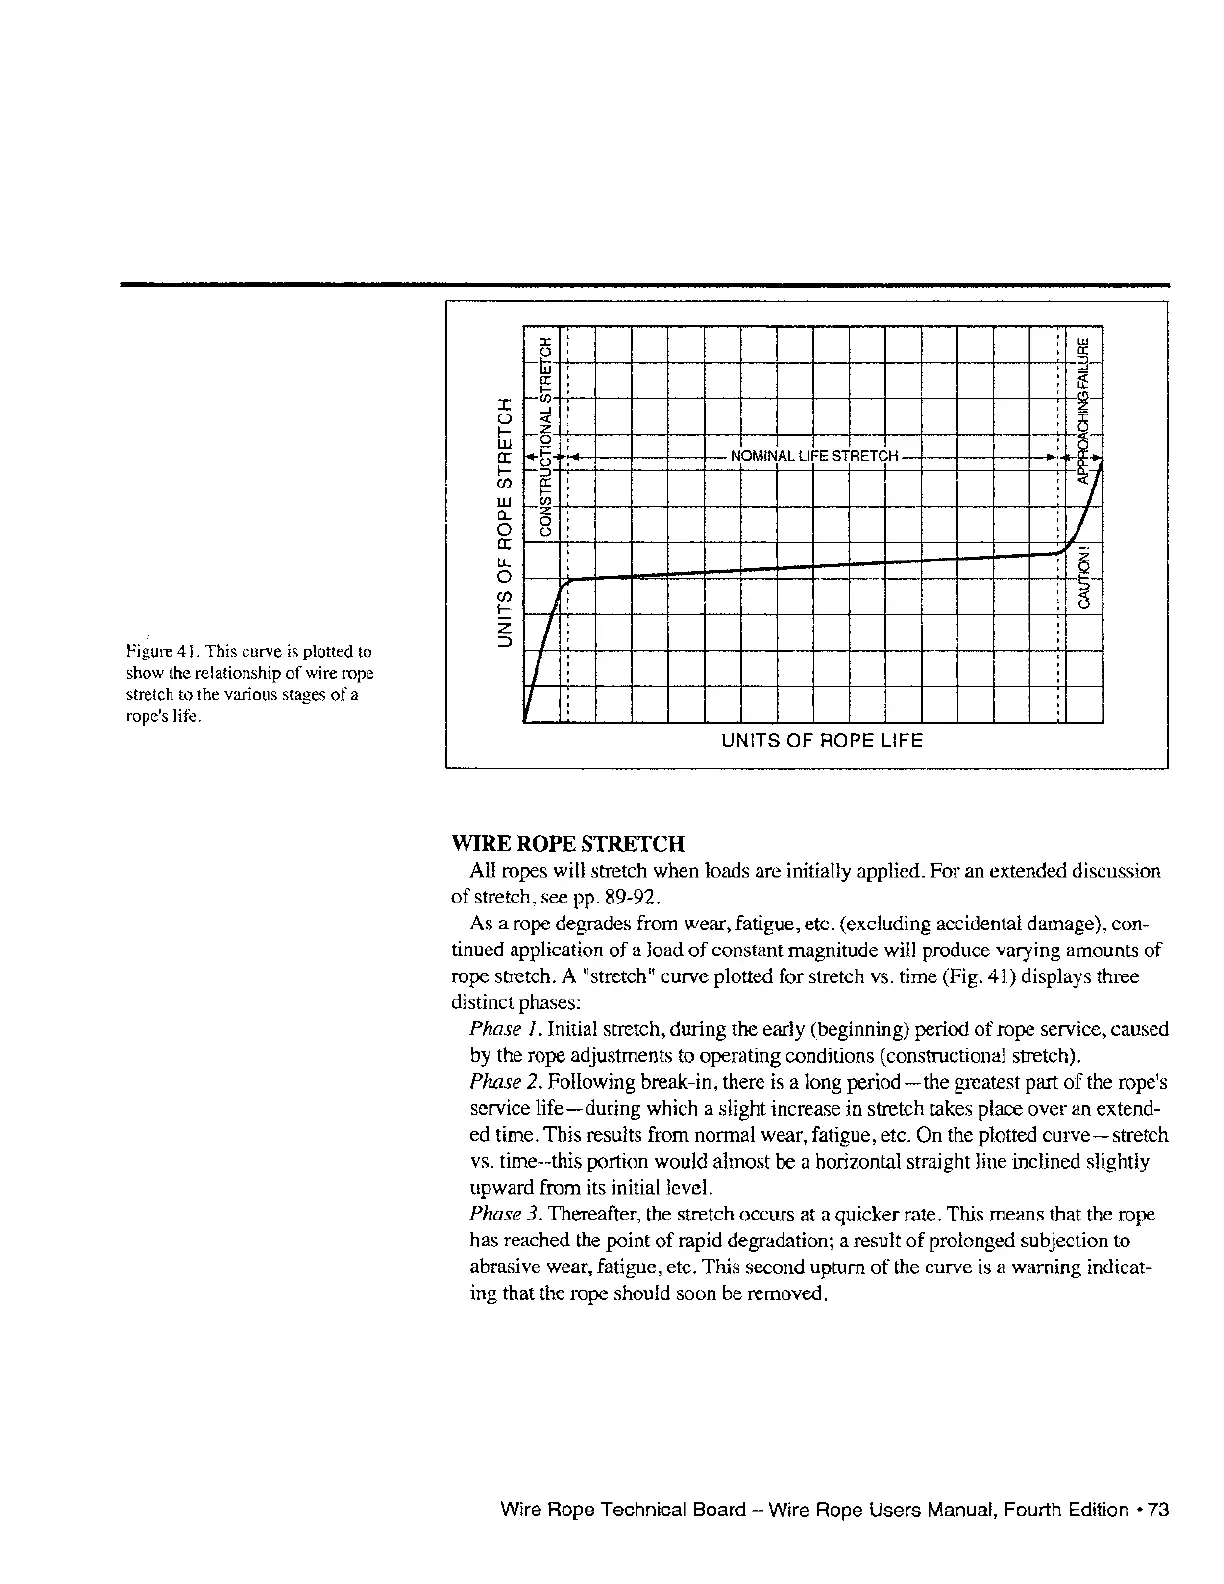
Figure 41. This curve is plotted to
show the relationship
of
wire rope
stretch to the various stages
of
a
rope's life.
:r:
()
I-
W
a:
I-
(J)
W
C-
O
a:
LL
o
(J)
I-
Z
::J
J:
,
,
f-~
,
a::
,
,
f-t>
,
....I
,
«
,
f-5
,
,
I+F
,
I-g
,
a::
,
f-
,
f-~
,
0
,
()
,
,
,
,
,
~
,
,
L:
I
,
,
,
,
~
,
,
,
WIRE
ROPE
STRETCH
l:l!
,
,
3-
,
,
if
:
,
~-
:
~-
NOMINAL LIFE STRETCH
:
~tE-lO;
:~
ill
~-
,
,
,
,
()
,
,
,
,
,
,
,
,
,
,
,
,
UNITS
OF
ROPE LIFE
All ropes will stretch when loads are initially applied. For an extended discussion
of
stretch, see pp. 89-92.
As a rope degrades from wear, fatigue, etc. (excluding accidental damage), con-
tinued application
of
a load
of
constant magnitude will produce varying amounts
of
rope stretch. A "stretch" curve plotted for stretch vs. time (Fig. 41) displays three
distinct phases:
Phase 1. Initial stretch, during the early (beginning) period
of
rope service, caused
by the rope adjustments to operating conditions (constructional stretch).
Phase 2. Following break-in, there is a long
period-the
greatest part
of
the rope's
service
life-during
which a slight increase in stretch takes place over an extend-
ed
time. This results from normal wear, fatigue, etc. On the plotted
curve-stretch
vs. time--this portion would almost be a horizontal straight line inclined slightly
upward from its initial level.
Phase 3. Thereafter, the stretch occurs at a quicker rate. This means that the rope
has reached the point
of
rapid degradation; a result
of
prolonged SUbjection to
abrasive wear, fatigue, etc. This second upturn
of
the curve is a warning indicat-
ing that the rope should soon
be
removed.
Wire Rope Technical Board - Wire Rope Users Manual, Fourth
Edition·
73