Appendix A: Functions and Instructions 179
dotP(
vector1
,
vector2
) ⇒
expression
Returns the “dot” product of two vectors.
Both must be row vectors, or both must be
column vectors.
dotP([a,b,c],[d,e,f]) ¸
aø d
+ bø e + cø f
dotP([1,2,3],[4,5,6])
¸ 32
DrawFunc CATALOG
DrawFunc
expression
Draws
expression
as a function, using x as the
independent variable.
Note: Regraphing erases all drawn items.
In function graphing mode and
ZoomStd
window:
DrawFunc 1.25xù cos(x) ¸
DrawInv CATALOG
DrawInv
expression
Draws the inverse of
expression
by plotting x
values on the y axis and y values on the x axis.
x is the independent variable.
Note: Regraphing erases all drawn items.
In function graphing mode and
ZoomStd
window:
DrawInv 1.25xù cos(x) ¸
DrawParm CATALOG
DrawParm
expression1
,
expression2
[,
tmin
] [,
tmax
] [,
tstep
]
Draws the parametric equations
expression1
and
expression2
, using t as the independent variable.
Defaults for
tmin
,
tmax
, and
tstep
are the current
settings for the Window variables
tmin, tmax,
and
tstep. Specifying values does not alter the
window settings. If the current graphing mode is
not parametric, these three arguments are
required.
Note: Regraphing erases all drawn items.
In function graphing mode and
ZoomStd
window:
DrawParm
tù cos(t),tù sin(t),0,10,.1
¸
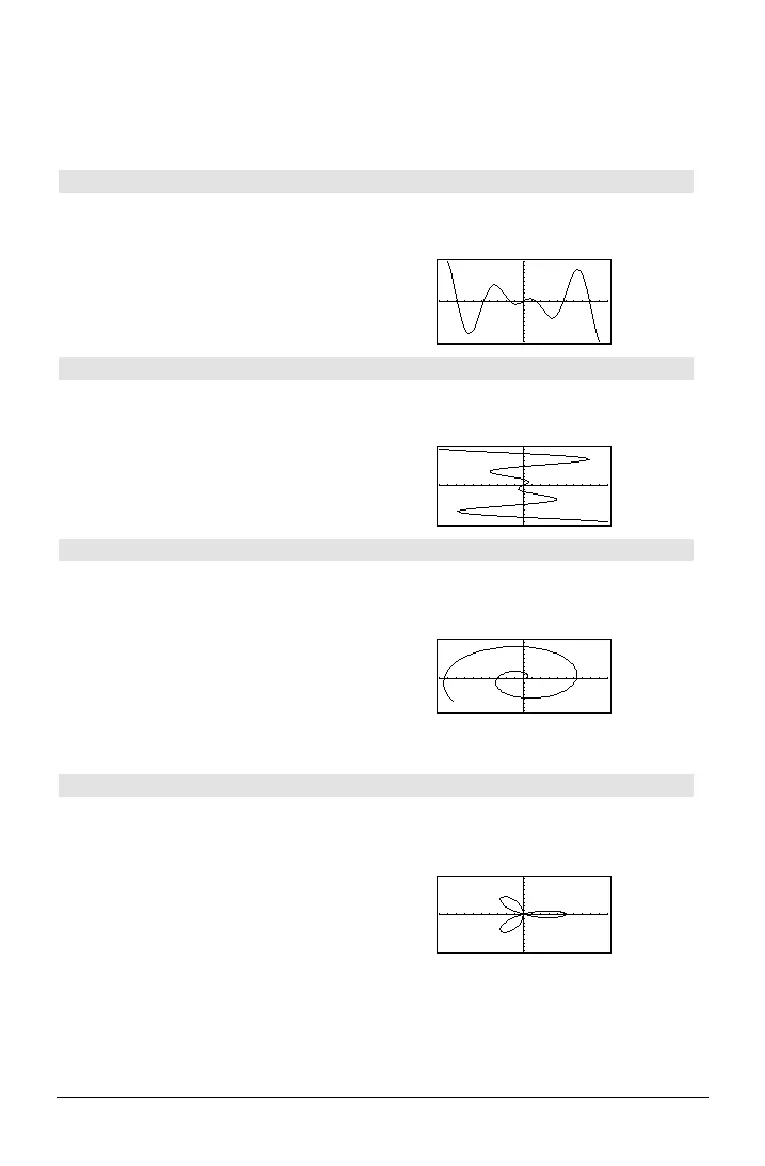
DrawPol CATALOG
DrawPol
expression
[, q
min
] [, q
max
] [, q
step
]
Draws the polar graph of
expression
, using q as
the independent variable.
Defaults for q
min
, q
max
, and q
step
are the current
settings for the Window variables q
min, qmax,
and q
step. Specifying values does not alter the
window settings. If the current graphing mode is
not polar, these three arguments are required.
Note: Regraphing erases all drawn items.
In function graphing mode and
ZoomStd
window:
DrawPol 5ù cos(3ù q),0,3.5,.1
¸

 Loading...


