© 2016 Thorlabs Scientific Imaging48
DCx Camera Functional Description and SDK Manual
Histogram and contrast
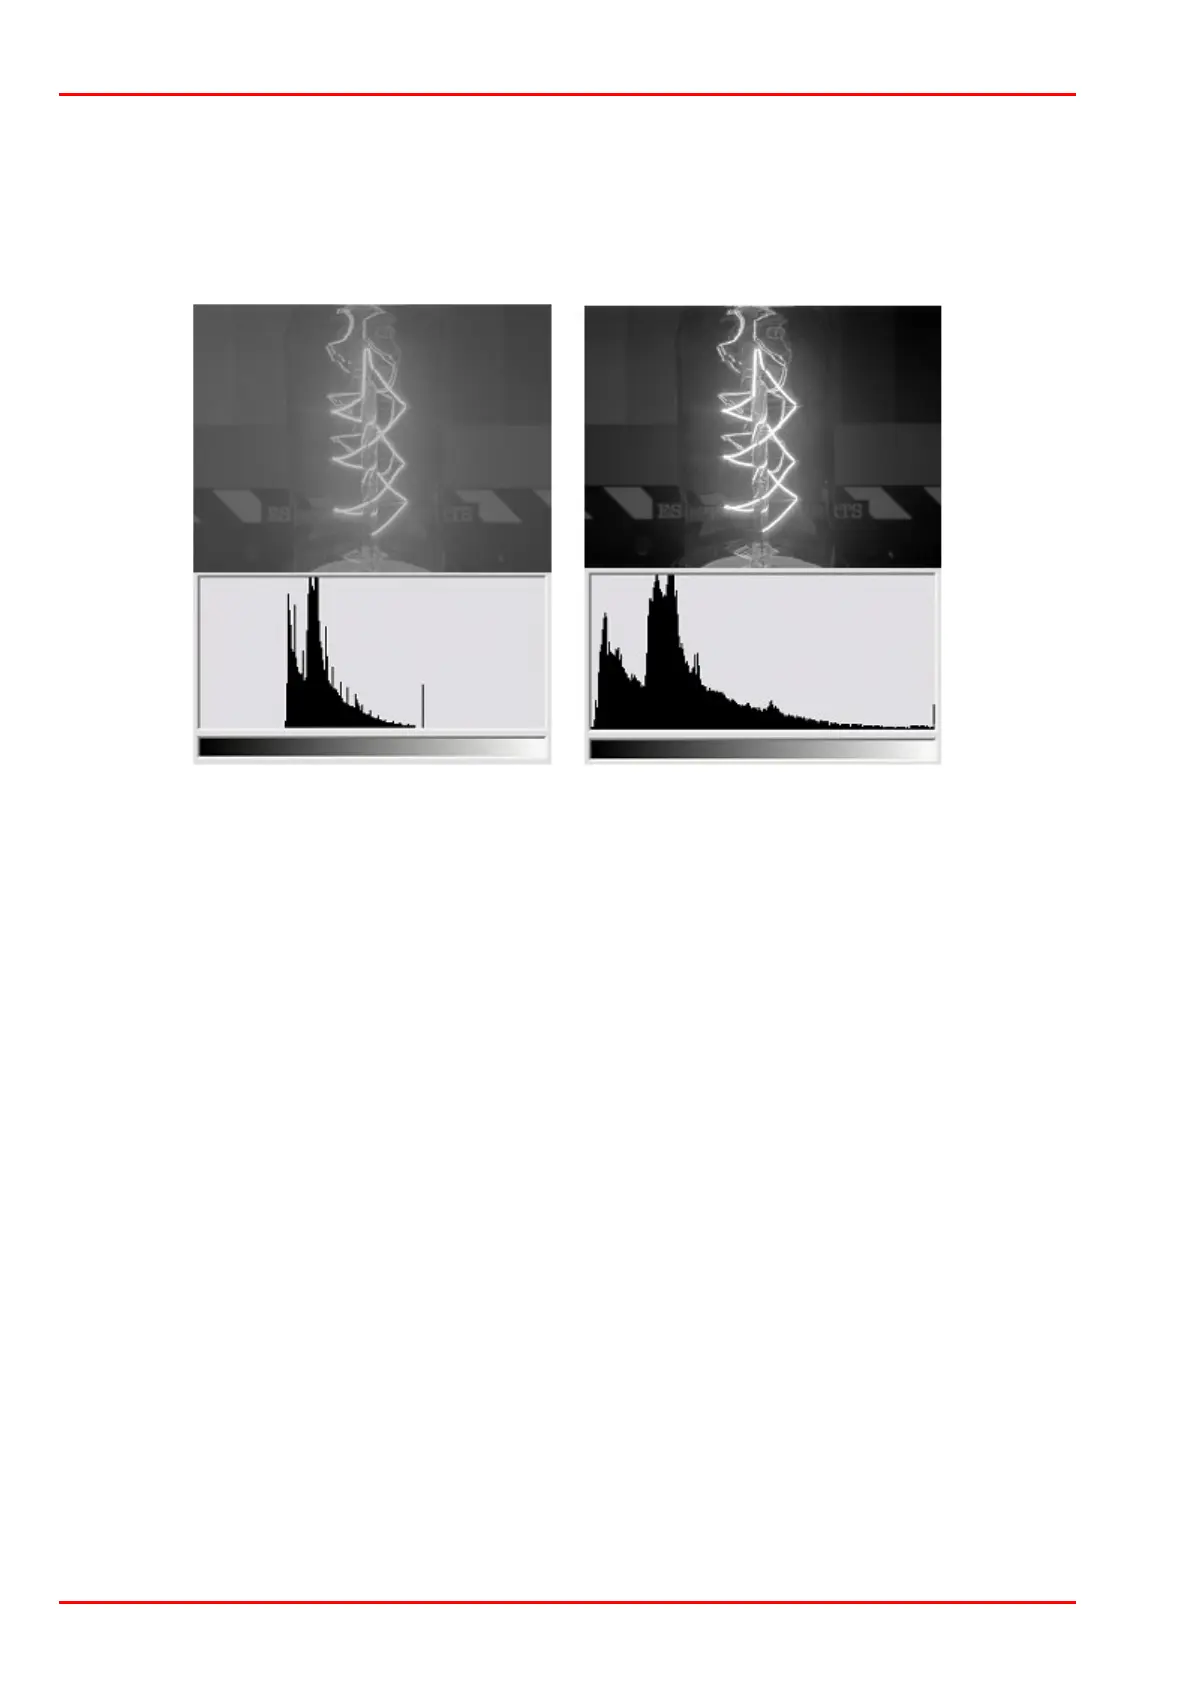
The brightness distribution of digital images is represented in a histogram. If an image has
optimum contrast, the histogram includes practically all brightness values between 0 and the
highest value (255 in 8-bit images). If an image has low contrast, the histogram only includes a
small number of the values; the image appears dull:
Image capture and histogram with minimal contrast (le.) and with optimum contrast after a contrast
adjustment (ri.)
For improved display on the screen or when printed, the histogram can be spread to optimally
utilize the possible brightness levels. For this purpose, the dark parts of the image are further
darkened via an LUT characteristic and the light parts of the image are brightened. Thus the human
eye can better differentiate between the different brightness levels; the image has more contrast.
It must be noted, however, that subsequent processing with a computer will not yield more data.
Therefore, subsequent contrast adjustment via software is not necessary for use in image
processing. The computer can differentiate between the differences in brightness without contrast
adjustment.
Advantage of greater bit depth with contrast adjustment
The bit depth in the output image is crucial for contrast adjustment. The following figures illustrate
this. In the first example the 8 bit output image contains fewer than 100 brightness levels, as there
are no dark or very bright parts. The image is low-contrast.
With a contrast adjustment, the values of the histogram are spread in such a way as to create a
contrast-rich image. The fewer than 100 brightness values are now distributed across levels 0 to
255; gaps arise in the histogram and are visible as jumps in brightness in the resulting image.
 Loading...