Refre
sh Rate: Enter a value in seconds to specify the refresh interval.
Traffic Summary
Port Select: Click the Select button to quick-select the corresponding port
based on the port number you entered.
Port: Displays the port number.
Packets Rx: Displays the number of packets received on the port. The erro
packets are not counted in.
Packets Tx: Displays the number of packets transmitted on the port.
Octets Rx: Displays the number of octets received on the port. The erro
octets are counted in.
Octets Tx: Displays the number of octets transmitted on the port.
Statistics: Click the Statistics button to view the detailed traffic statistics of the
port.
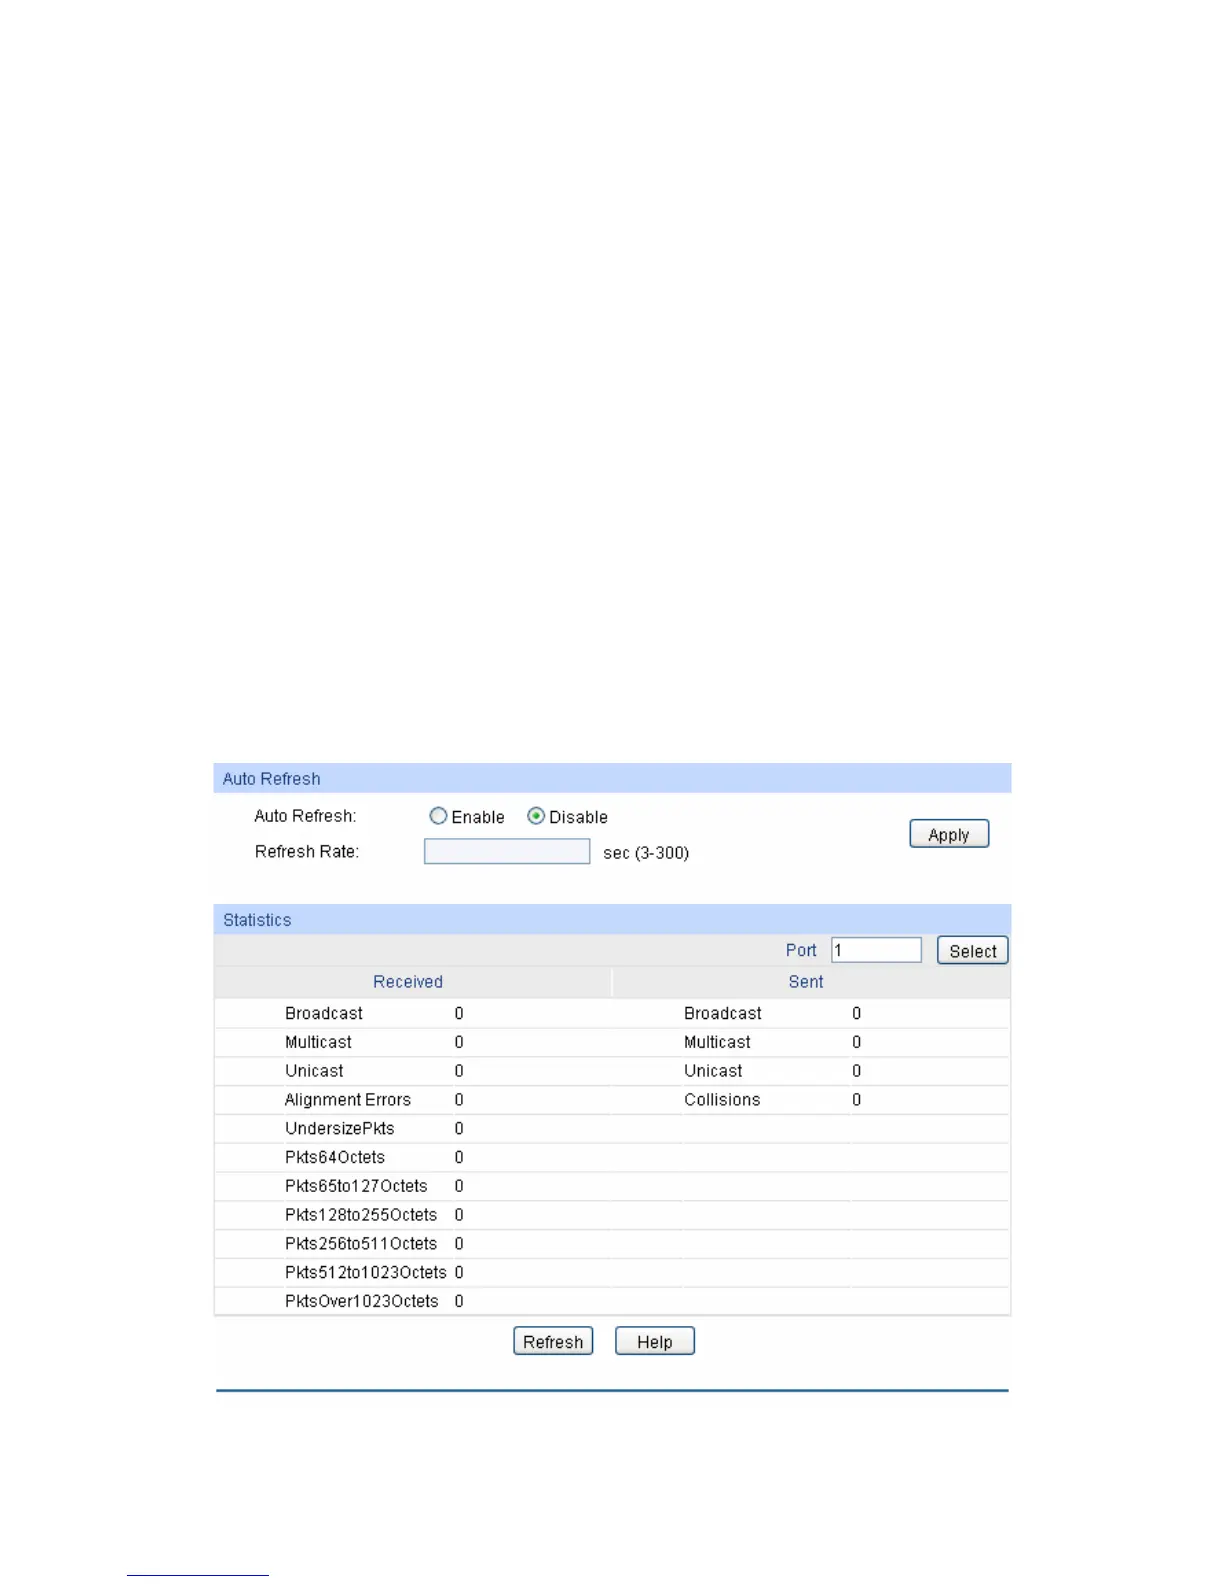
5.3.2 Traffic Statistics
Traffic Statistics screen displays the detailed traffic information of each port, which facilitates you to
monitor the traffic and locate faults promptly.
Choose the menu Switching→Traffic Monitor→Traffic Statistics to load the following page.
Figure 5-11 Traffic Statistics
42
 Loading...