4-7
IM AQ1210-01EN
Performing Averaged Measurements
4
Average Count and Average Duration
With the auto setting, the average method is selected according to the distance range and the loss
in the optical fiber cable being measured.
Attenuation
With the auto setting, an attenuation value is selected according to the distance range and the loss
in the optical fiber cable being measured. If you want to set the attenuation value manually, select a
value appropriate for the pulse width. For details on the attenuation value appropriate for the pulse
width, see section 2.1.
Switching the Display between TRACE Mode and MAP Mode
You can switch the data display screen.
TRACE mode: The data display screen shows the waveform of optical pulse measurement.
MAP: The data display screen shows the events detected through event analysis and displays
them with icons.
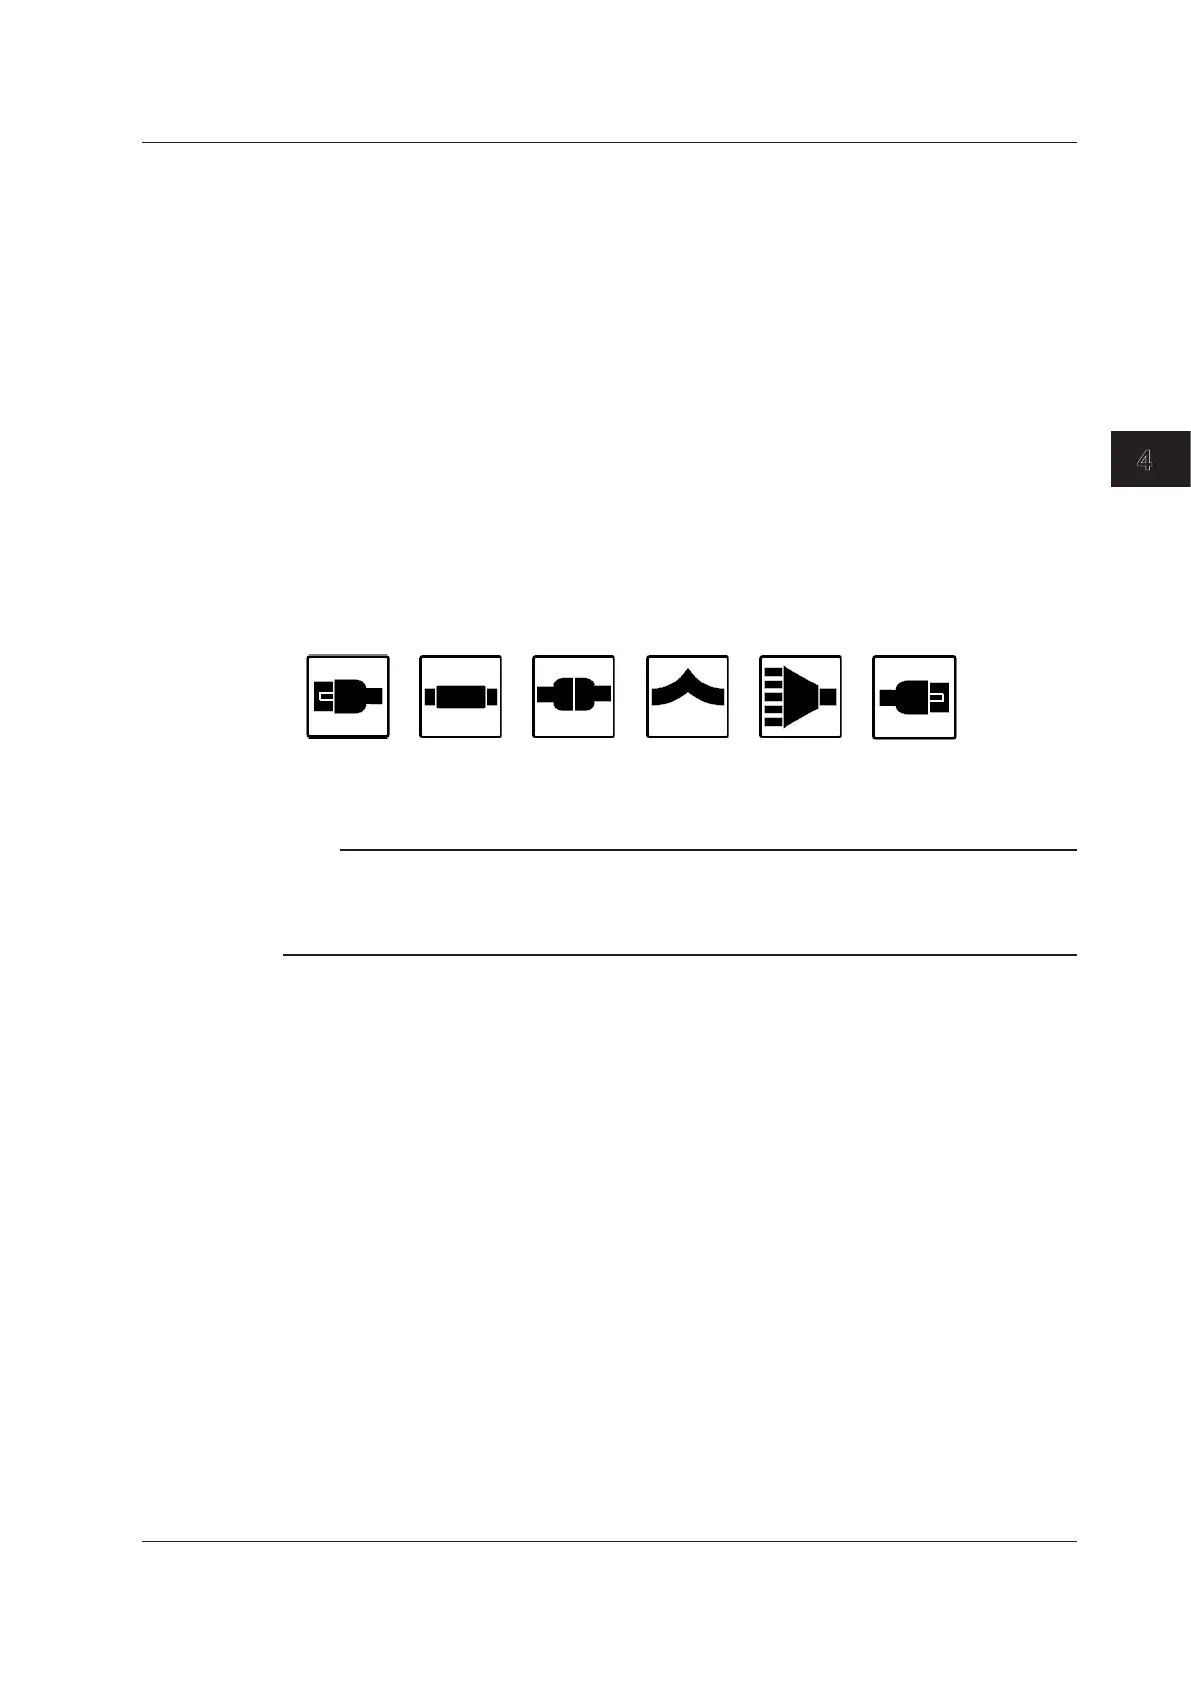
• Event Icon Display
The following events are displayed using icons.
Splice loss
Return loss
Bending loss
Splitter
End point
(Fresnel
reflection)
Start point
(Near-end
reflection)
Note
When the data display screen is in MAP mode, the following features cannot be used.
• Operating the cursors
• Performing marker analysis
• Zooming In on or Out of Waveforms
4.2 Measuring in MAP Mode
 Loading...