5-13
IM AQ1210-01EN
Analyzing Events
5
5.2 Analyzing in MAP Mode
Procedure
Executing an Event Analysis
1.
Press MENU to display the MENU screen.
For details on the MENU screen, see the Getting Started Guide, IM AQ1210-02EN.
2.
Tap OTDR to display the OTDR screen.
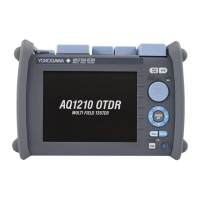
• Switching the Display between TRACE Mode and MAP Mode
3.
Tap the TRACE/MAP button to set the data display screen to MAP mode.
When the data display screen is in MAP mode, the button is TRACE.
Note
If you switch the data display screen to MAP mode, event analysis is automatically performed.
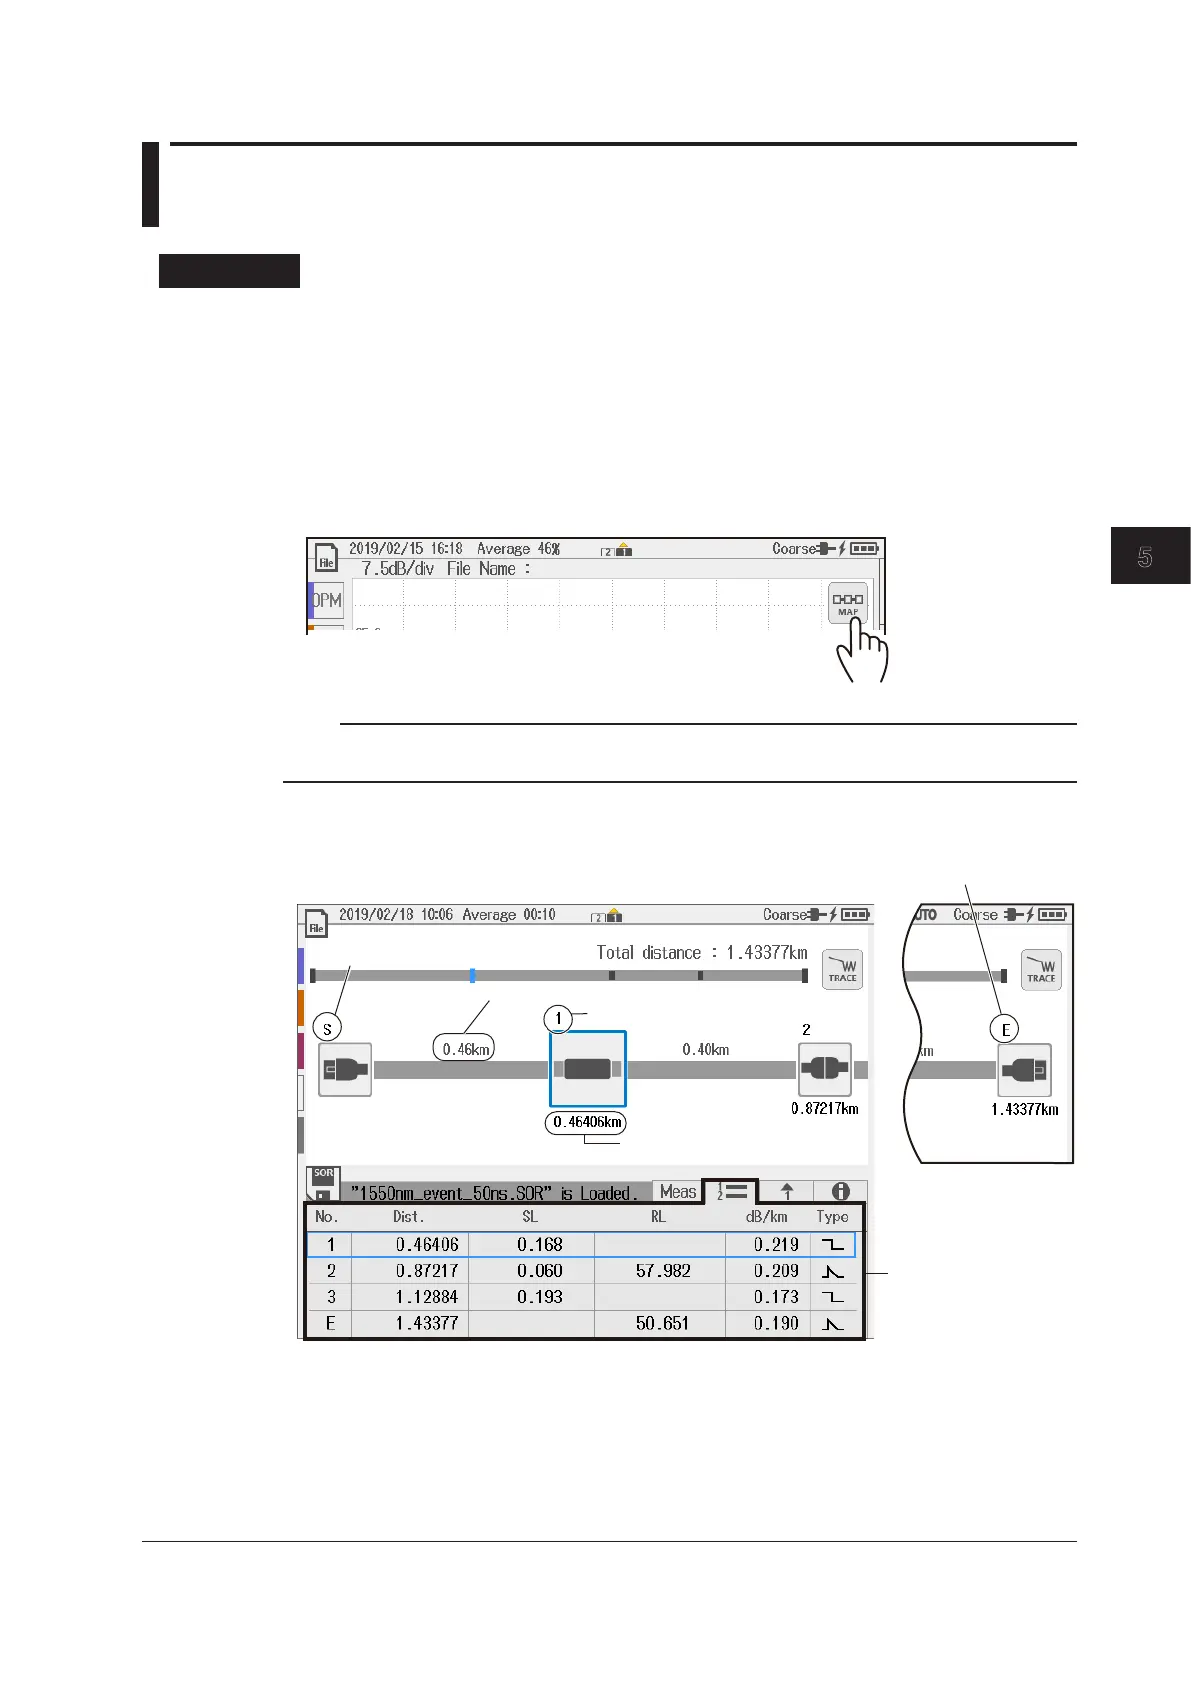
The results of event analysis are displayed with icons.
Displaying Event Analysis Results
Measurement
reference point: S
Event No.
Event detected as the end of the optical fiber cable: E
List of events
Displayed by tapping the
List tab.
Distance between events
Distance from the measurement
reference point
 Loading...