Technical Information DFS 700 / 04.2009 8-9
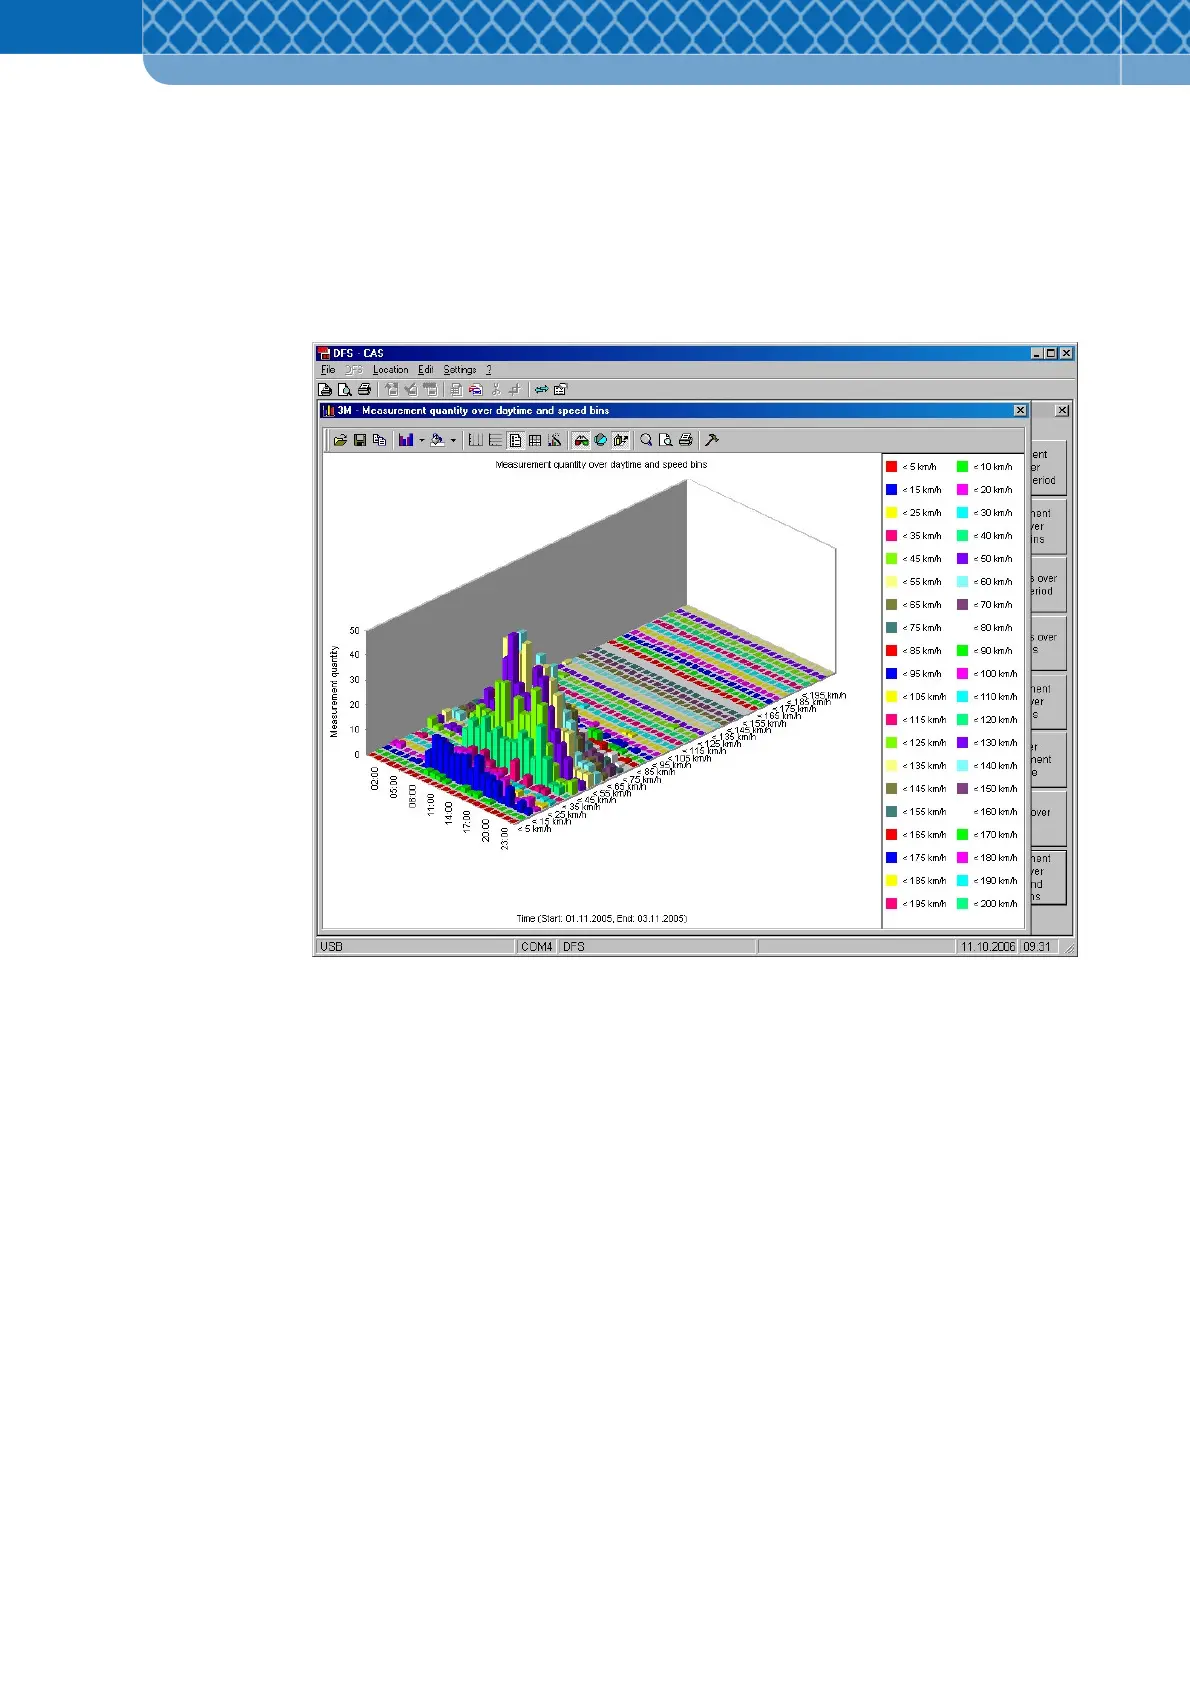
“Measurement quantity over daytime and speed bins” button
This 3-D chart unites the displays of Figure 8-6 and Figure 8-9. It shows in three axes the
number of measurements related to time-of-day and speed intervals for the selected reporting
period according to the defined speed and time intervals in the "Data report" window (Figure 8-
4).
Figure 8-12 Measurement quantity over daytime and speed bins