User’s Manual
Enterprise Access Point ENGLISH
Copyright © 4IPNET, INC. All rights reserved.
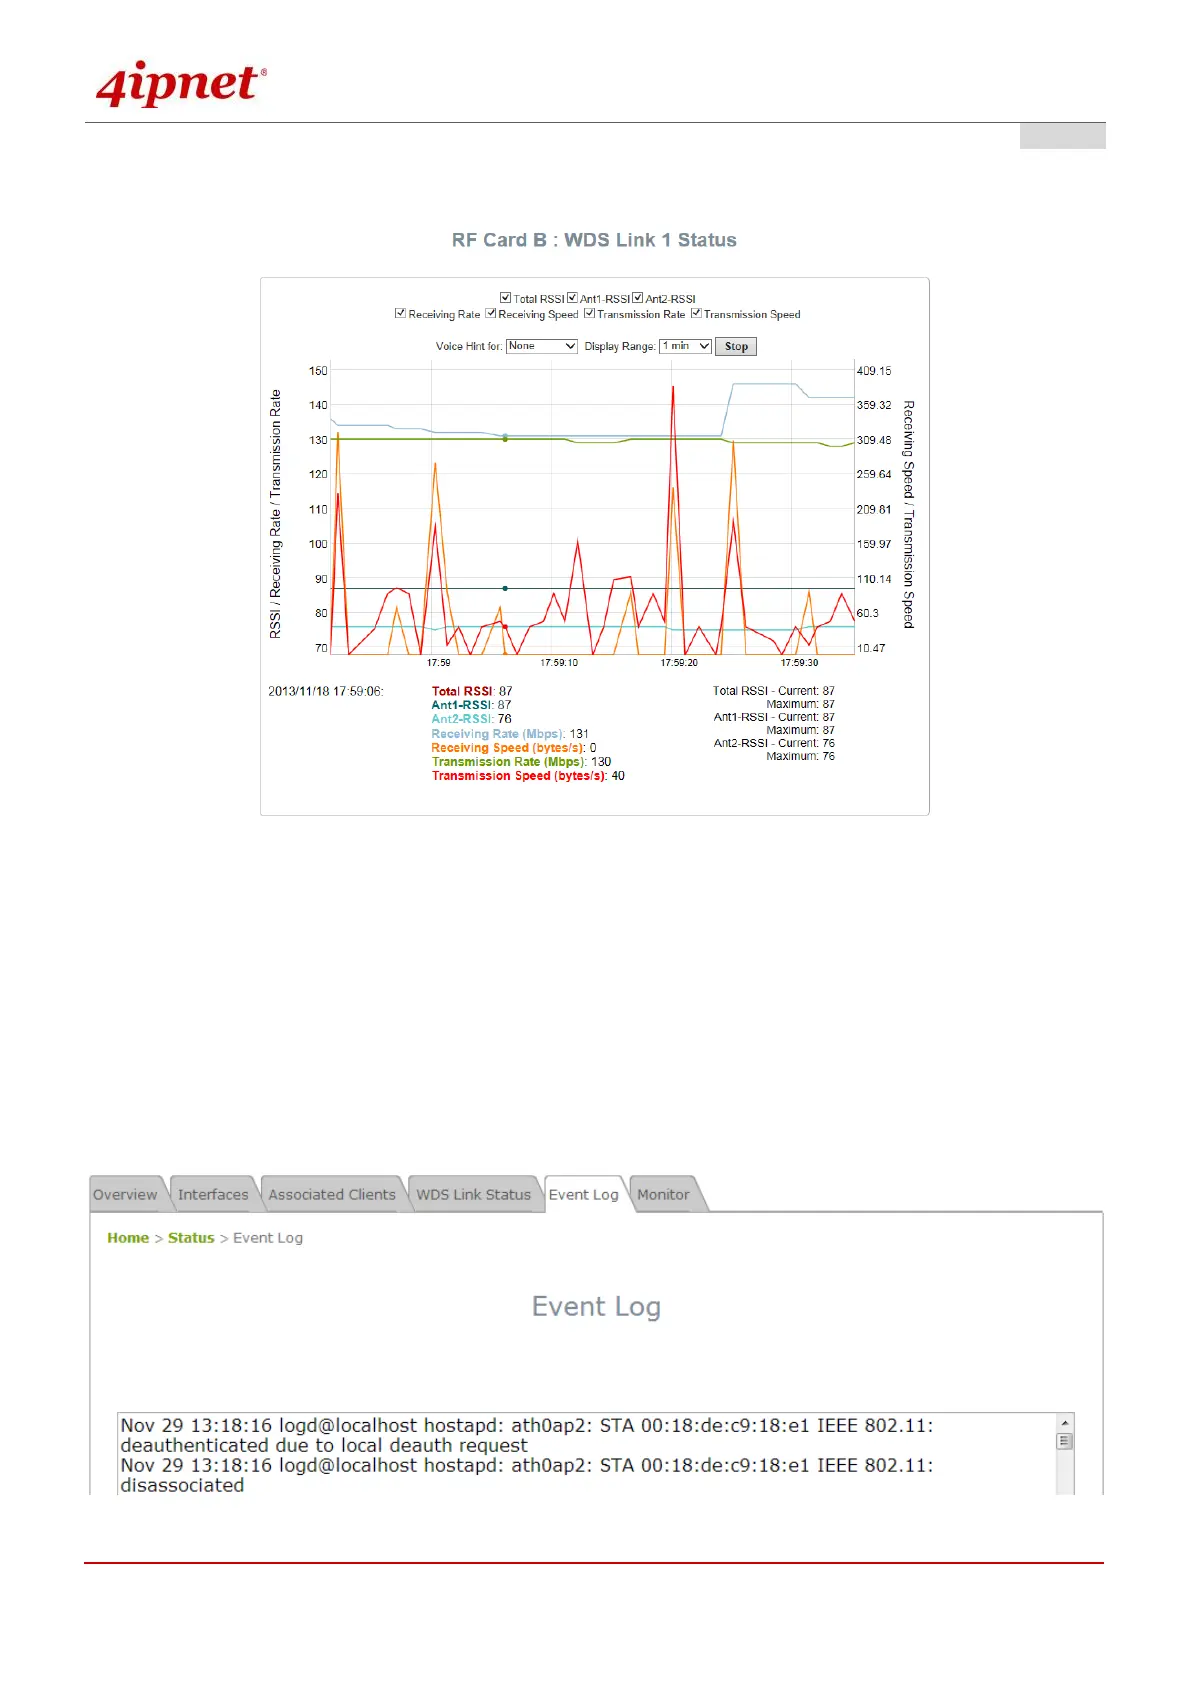
By clicking plot, a dynamic graph for WDS link status is displayed. Information on the plot includes Total RSSI, Ant1
RSSI, Ant2 RSSI, Transmission Rate, Receiving Rate, Transmission Speed, and Receiving Speed.
The Time Axis is configurable with the following options: 1 minute, 2 minutes, 5 minutes, or 10 minutes. Left click
on the mouse to zoom in on desired regions. Double click to return the plot to its original scale.
Voice hint may also be enabled for convenience during antenna adjustment.
7.5.5 Event Log
The Event Log provides a record of system activities. The administrator can monitor the system status by
checking this log.
Event Log Page