6-2 Programmer’s Guide
Trace Data Transfers
Trace Data Transfers
Trace Data Transfers
This chapter explains how to read (query) the measurement data trace
from the analyzer into your program. It also describes how to send data
from your program to the analyzer's measurement arrays. Accessing the
measurement arrays is done using SCPI commands. If you are using
IBASIC, you can also access the measurement arrays using high-speed
subroutines. Refer to the HP Instrument BASIC User's Handbook for
more details.
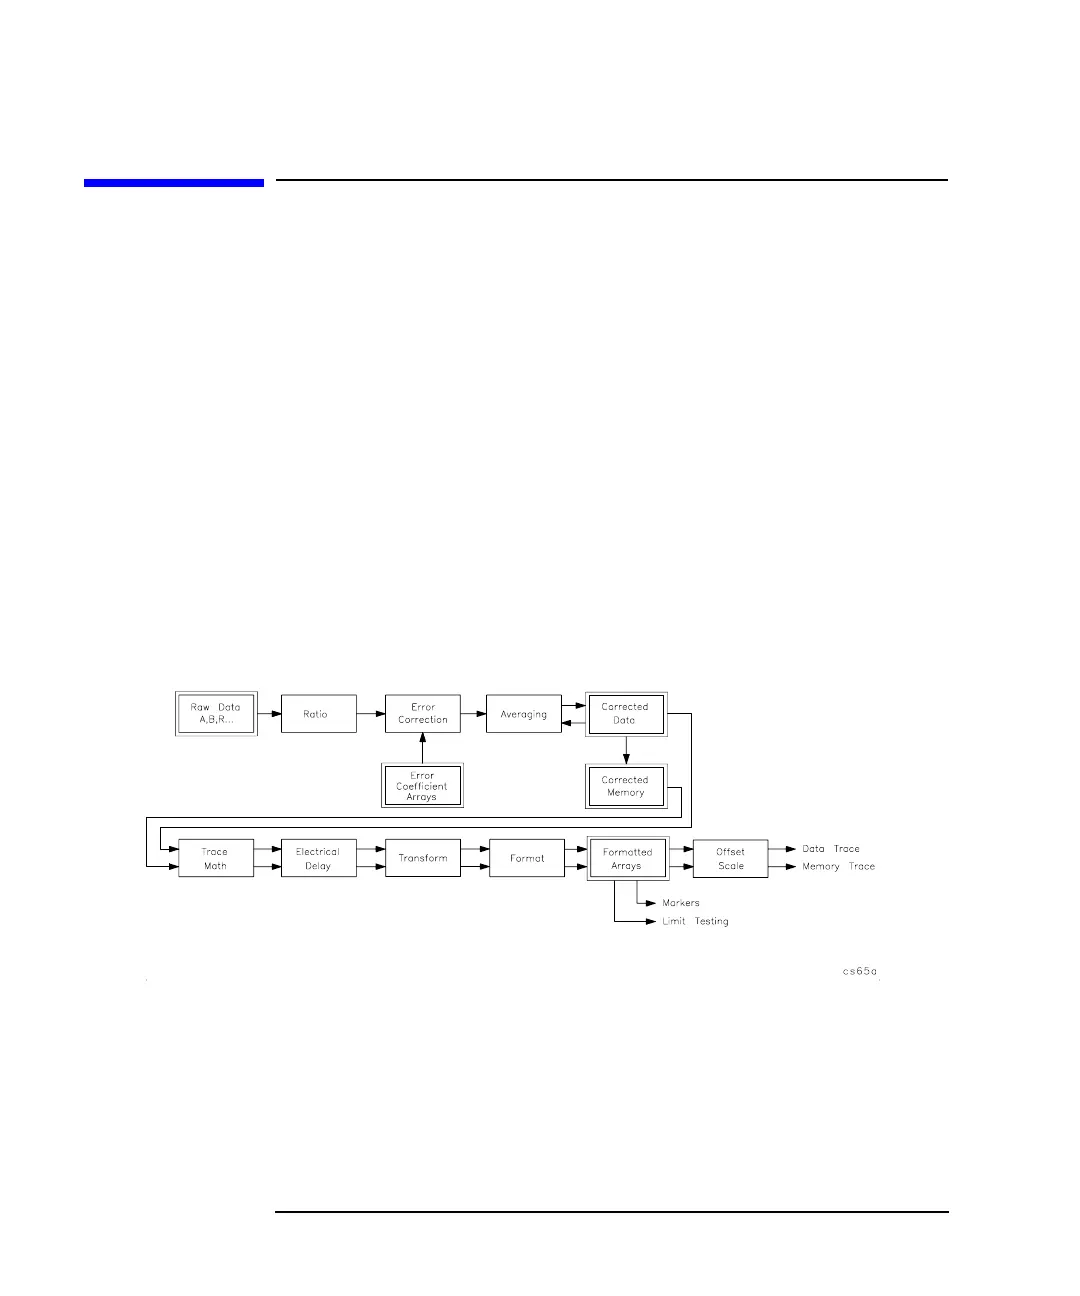
Figure 6-1 is a data processing flow diagram that represents the flow of
numerical data. The data passes through several math operations,
denoted in the figure by single-line boxes. Most of these operations can
be selected and controlled with the front panel CONFIGURE block
menus. The data is stored in arrays along the way, denoted by
double-line boxes. These arrays are places in the flow path where data is
accessible via GPIB. While only a single flow path is shown, two identical
paths are available, corresponding to measurement channels 1 and 2.
Figure 6-1 Numeric Data Flow Through the Network Analyzer

 Loading...

