Third Page
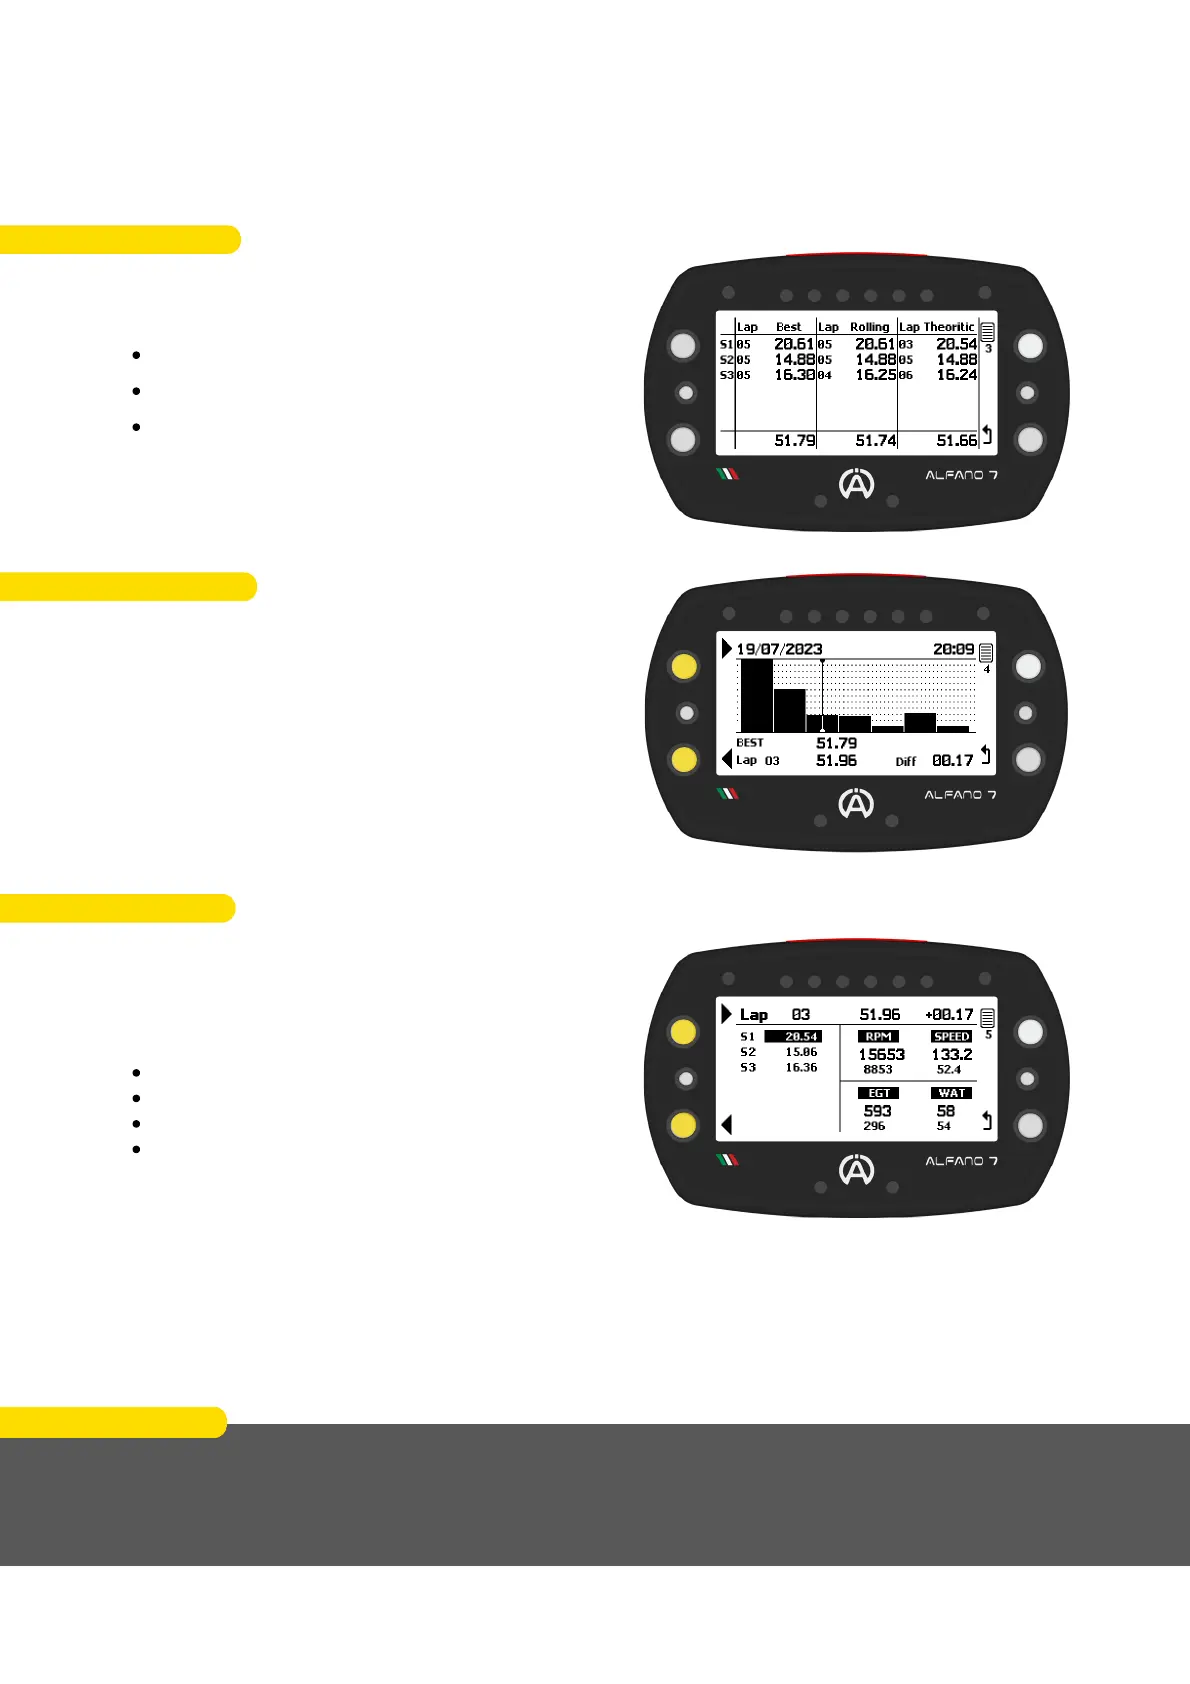
Continuing the analysis on the third page will
be shown:
Best lap
Rolling lap
Theoretical lap
All with their respective sector times and the
number of the lap in which the sector time in
question was done
Fourth Page
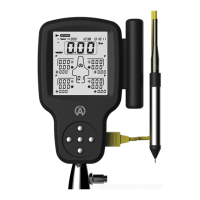
On the fourth page of the data analysis, you
can view the lap time's temporal evolution
graphically. Use the upper and lower left
buttons to select different laps
The session's best lap time is displayed,
followed by the time of the selected lap and
its relative gap
Fifth Page
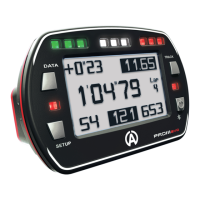
If present, the sectors that make up the lap are shown, the sectors with the best time of the
session will be highlighted
If the lap is the best, the word "best" will be present at the top right, otherwise the
difference in time compared to the best of the session
On the fifth analysis page, depending on the
lap selected on the previous page, a summary
of the selected lap is shown
The maximums and minimums of:
RPM
Speed
T2 exhaust
T1 water
You can navigate to the next or previous lap
using the upper and lower left buttons
EXAMPLE
In the example shown, sector 1 of lap number 3 is highlighted since it is best first sector of
the session
In the top right there is the gap compared to the best lap of the session, in this case the lap
was 0.17 seconds slower
80
10. Data Analysis Directly from the Alfano 7