To analyze another lap, return to the previous page and select the desired lap
The graph at the centre of the screen displays the engine RPM throughout the lap
The track is located at the bottom right, which shows the position of the vehicle at the
point of the lap being analysed, in addition to the finish line and split times (if present)
The time taken by the vehicle to reach the point of the track being analysed is shown on
the top left and the total lap time is shown on the right
The Alfano 7 analysis is limited to 10 Hz. For more detailed analysis at 100 Hz, ADA (Alfano
Data Analysis) must be used. ADA is available for Windows PCs and Android and iOS
mobile devices
To analyze another lap, return to the previous pages where you can select another lap
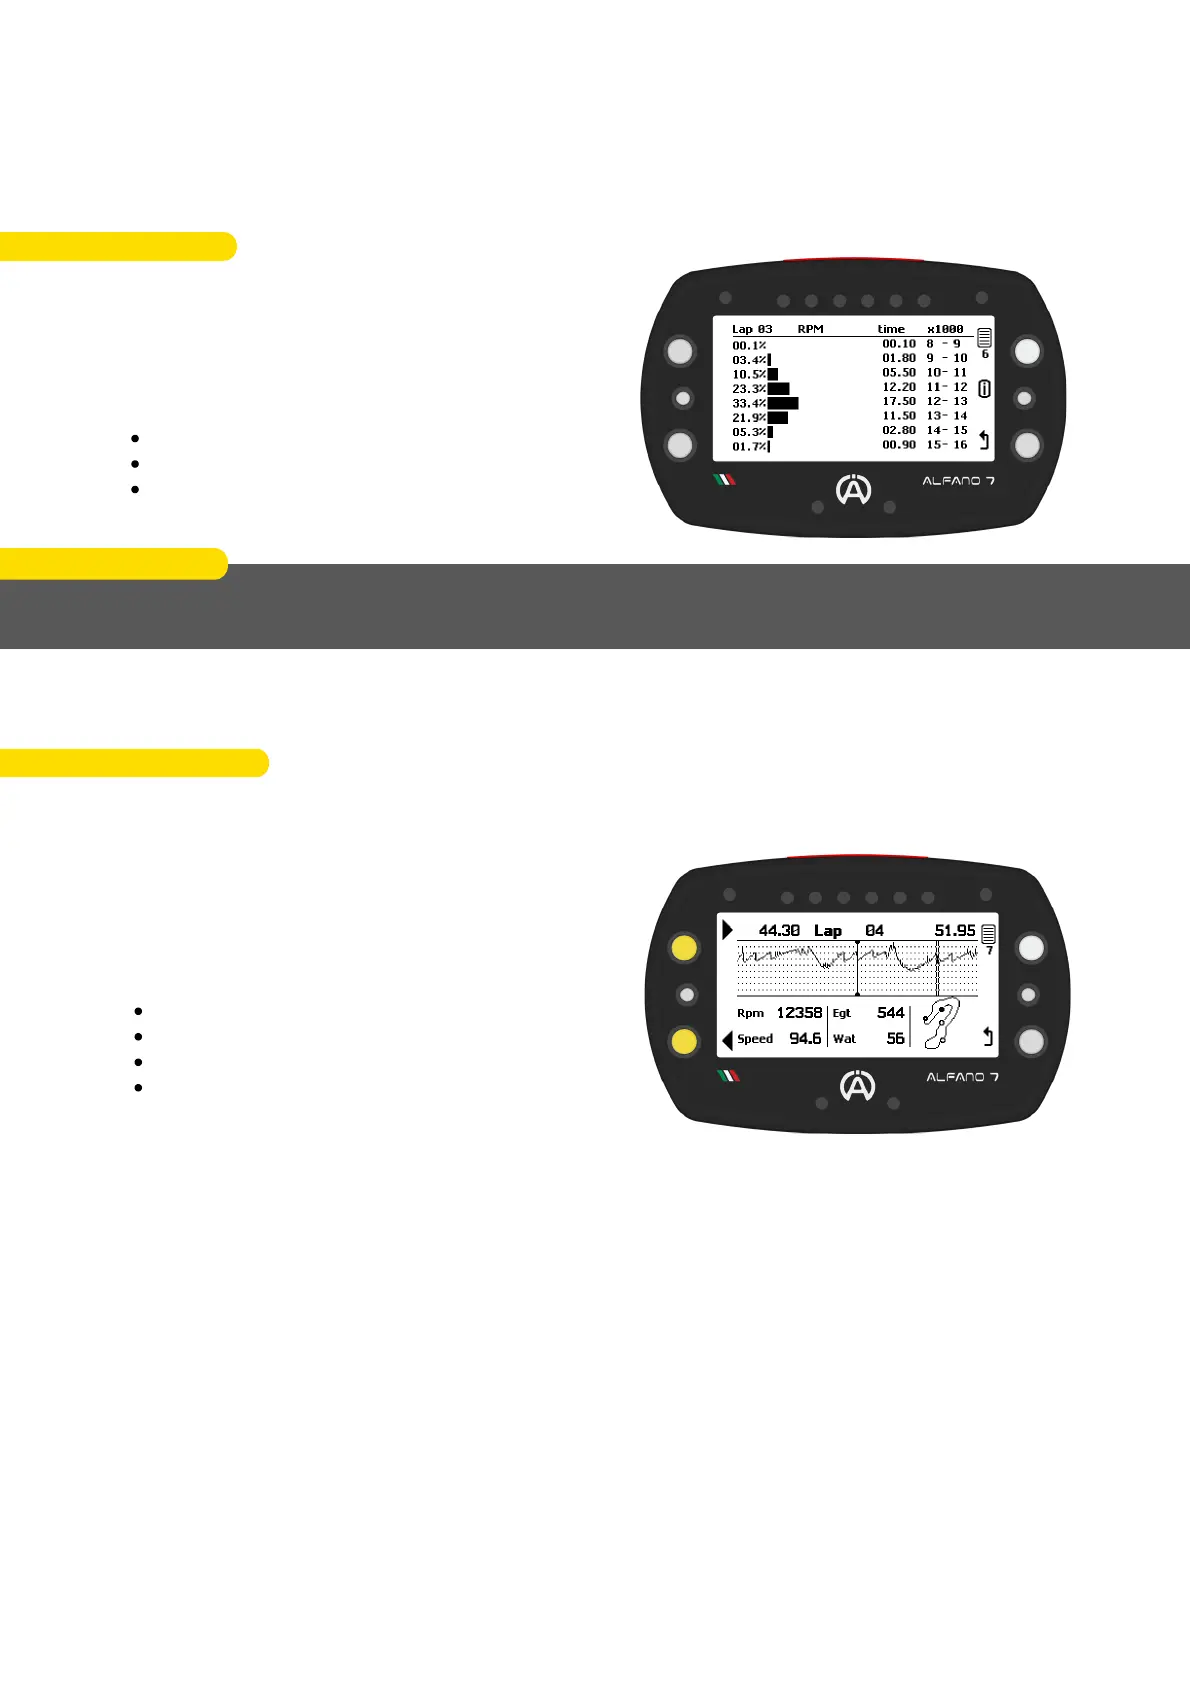
Sixth Page
On the sixth screen of the analysis, the engine
RPM is divided into intervals of 1000 RPM for
each lap
The operating time of the engine in each
specific RPM range is indicated as:
Percentage
Graphical way
Amount of time
EXAMPLE
During lap 3, the engine operated at RPMs between 11000 and 12000 for 12.20 seconds,
which is 23.3% of the total lap time.
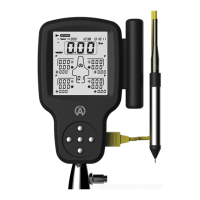
Seventh Page
The seventh page of the analysis menu allows for the analysis of the entire selected lap at a
frequency of 10 Hz
In one-tenth of a second increments, using the
buttons at the top and bottom left, you can
move around the track and analyse for each
point:
RPM
Speed
T2 exhaust
T1 water
81
10. Data Analysis Directly from the Alfano 7